Reading FUSION
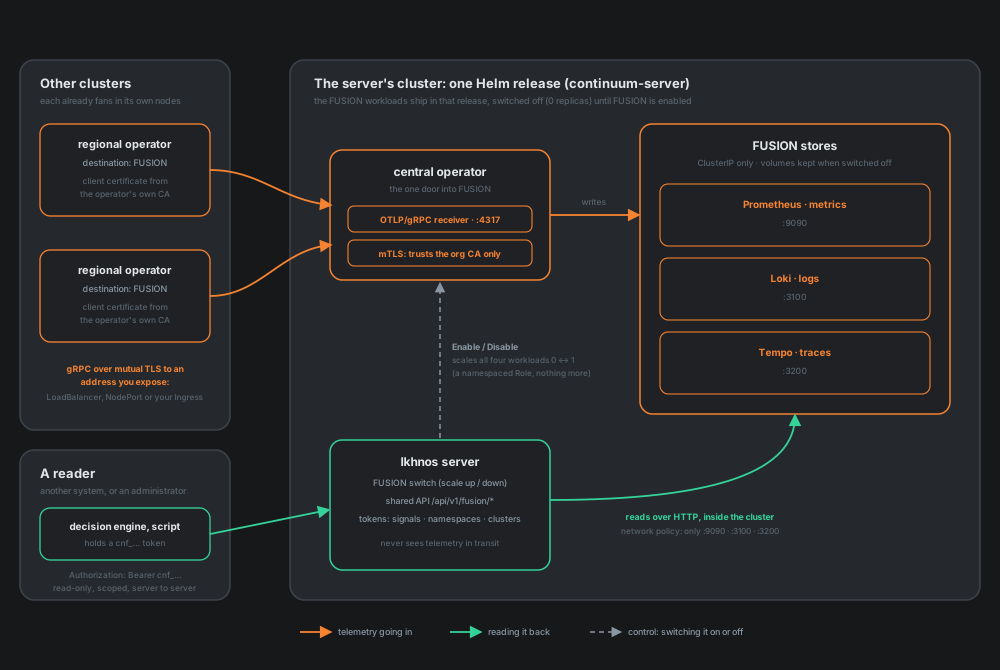
FUSION saves what the central operator receives: metrics in Prometheus, logs in Loki, traces in Tempo, three stores that authenticate nothing and are never exposed. The shared API is the one way another system reads them back: a decision engine that wants the spans and logs behind a slow request, a dashboard, a script. It lives in the Ikhnos server, under /api/v1/fusion, so there is nothing more to install and one credential model for everything.
It does two jobs. It lets a caller read each signal on its own, with filters that are the same across the three stores (service, namespace, pod, cluster, a time range). And it fuses them around a trace: one call returns the trace's spans, each carrying the log lines written under its span id, and each resource (a service in a pod in a namespace) carrying the metric series saved for it around the trace's time.
Who can read
There are two kinds of caller, and nothing else is accepted.
A FUSION access token (cnf_…) is for another system. An administrator of the server's main organisation makes one on the FUSION page, Access tab (New API token), gives it a name, picks which signals it may read, optionally limits it to some namespaces and some cluster ids, and chooses how long it lasts (30 to 365 days, 90 by default). The secret is shown once; only its SHA-256 is stored, as with every other secret here. A token is read-only, it can be revoked at once from the same tab, and it opens nothing but this API: presented to any other part of the server, it is refused.
A signed-in administrator of that organisation (a browser session or a personal access token) can read everything, which is what lets the UI explore the data without minting a token for itself. A viewer or an editor cannot: the stored telemetry is more than the topology they can already see.
Making and revoking a token are audited, with the name and the scope and never the secret. Reads are not audited one by one (a dashboard would write thousands of rows); each token records when it was last used, and each caller is rate limited (600 requests a minute, bursts of 60). A token belongs to the organisation, not to the administrator who made it: it keeps working if that person leaves, and any administrator of the organisation can list and revoke it. A token whose stored scope cannot be read back is refused rather than treated as unlimited.
curl -H "Authorization: Bearer $TOKEN" https://ikhnos.example/api/v1/fusion/status
A browser on another origin cannot call it: the Authorization header is not among the headers the server's CORS policy allows, the same as for personal access tokens. It is a server-to-server API.
What a token can see
A token's scope has three parts: the signals it may read (metrics, logs, traces), the namespaces whose telemetry it may see, and the clusters whose telemetry it may see. Empty namespaces or clusters means no limit on that part.
The limit is enforced twice. Every query a limited token causes is built by the server from structured filters, never from text the caller wrote, with the scope's matchers added to it: a k8s_namespace_name matcher in the PromQL selector, in the LogQL stream selector and in the TraceQL condition, and a continuum_cluster_id one beside it (in Loki continuum_cluster_id and continuum_org_id are stream labels, so they work in the selector and after a pipe). Then each answer is checked again against the scope before it leaves, so a store that ignored a matcher still cannot leak a line. Telemetry that carries no namespace (node metrics, say) is invisible to a token that limits namespaces: the limit fails closed.
Two consequences follow, and both are deliberate:
- A limited token cannot send a raw query. PromQL, LogQL and TraceQL written by hand cannot be restricted safely without parsing them, so
metrics/query,metrics/query_range,logs?query=andtraces?q=need a token with no namespace and no cluster limit (or an administrator). Everything else works for every token. - A limited token sees spans, not whole traces. A trace that crosses namespaces comes back with only the spans of the namespaces the token may see; a span whose parent is hidden is shown as a root, and the hidden parent's id is not given. A trace with no visible span reads as not found, which is also what a trace that does not exist reads as, with the same message. In a search result the trace's root service and name are left blank for a limited token (the root may be in a namespace it cannot see), and its start time and duration are those of the spans that matched, not of the whole trace; it gets the services of the spans that matched.
What the server does with the data matters too: the stores are reached over plain HTTP inside the cluster (their ClusterIP Services), and the server chart's network policy, when you turn it on, lets the server pod reach exactly those three ports and nothing else of FUSION. The server never sees telemetry in transit (the central operator writes straight to the stores), but it now reads stored telemetry and returns it to token holders. That is what the feature is; it is why only administrators of the main organisation can make tokens, and why a token's scope is narrow by choice.
The calls
All are GET (but the batch read, and the backends' own POST forms), all take from and to (an RFC 3339 time, unix seconds, or an offset such as now-15m or now-7d; default the last hour, never more than 31 days, of which a trace search takes at most 7 and a log read at most 30 per query) and answer JSON. Durations and offsets accept d and w as well as s, m and h.
| Call | What it returns |
|---|---|
/api/v1/fusion/status | FUSION's own state, and what this caller may read (signals, namespaces, clusters, expiry, whether raw queries are allowed). |
/api/v1/fusion/applications | The Ikhnos applications (groups of services, made by a person or found by discovery), each with its services (each with an id, its name, namespace, cluster, kind, aliases and signals), namespaces and clusters, and which signal types FUSION has for them in the range. Pass an application's id or name as application to the reads below (filtering by application). |
/api/v1/fusion/applications/{name} | One Ikhnos application at a glance (name is its id or name): its signals across all its services, recent traces, recent traces with an error span, recent error-level log lines, the metric names it reports. |
/api/v1/fusion/applications/{name}/topology | The service-to-service traffic of one Ikhnos application, now or as of an earlier time (application topology). |
/api/v1/fusion/services | The services that have telemetry in the range (their service.name), which signal types each has, and the Ikhnos applications each is in (applications; empty for infrastructure that reports under a name of its own, such as an exporter). application= keeps only the services of one application. |
/api/v1/fusion/services/{name} | One service at a glance: the same overview, for a single service.name. |
/api/v1/fusion/metrics/names, /series, /range | Metric names, series label sets, and series values over the range, filtered by name, metric (a regular expression over the name), service, namespace, pod, node, cluster, application, category. /range takes step and limit, and needs at least one of name, metric, service, namespace, pod, node or application; without one it answers 400. |
/api/v1/fusion/links | The latest figures of the links between clusters, for the pairs the organisation watches: loss in each direction, round trip, delay variation, path MTU, throughput and when they were measured. Each pair once, with measuredBy; cluster and peer narrow it (cluster links). Needs the metrics signal. |
/api/v1/fusion/metrics/query, /query_range | PromQL as written, answered in Prometheus' own shape. Unrestricted callers only. |
/api/v1/fusion/logs | Log lines, with service, namespace, pod, cluster, application, category, trace_id, span_id, severity, contains, order=newest|oldest, limit. With query= it takes LogQL as written (unrestricted callers only). |
/api/v1/fusion/traces | A trace search: service, namespace, cluster, application, category, name, status=error|ok|unset, min_duration, max_duration, limit. With q= it takes TraceQL as written (unrestricted callers only). With fused=true every hit also comes back as a fused trace (reading many). |
/api/v1/fusion/traces/{id} | One trace. With fused=true (or an include list) it is the fused object below. |
POST /api/v1/fusion/traces/batch | Up to 25 fused traces in one request (reading many). |
/api/v1/fusion/prometheus/..., /loki/..., /tempo/... | Each store's own read API, unchanged (the backends' own APIs). |
/api/v1/fusion/openapi.json, /api/v1/fusion/docs | The OpenAPI description of all of the above, and a page that renders it and lets you try each call (the API page). No credential needed: they describe the API, they read nothing. |
Lists say when they are cut. metrics/names, metrics/series, metrics/range, traces and logs answer with truncated (true when more matched than limit allowed), the limit that applied, and the from and to of the range actually read, so a caller with a full page knows to narrow the filters or the range. /services and /applications carry warnings that say what the answer leaves out, and the overview of an application or service carries metricsTruncated when its metric names were cut. To learn whether there was more, FUSION asks the store for one more than the caller's limit, so a store's own log shows a limit one higher than the one passed in.
The backends' own APIs
Everything above is FUSION's own shape: one set of parameters (from, to, service, namespace ...), one error format, one access model, whichever store the data is in. For everything the three stores can do beyond that (aggregations, label and tag discovery, log volumes and patterns, TraceQL metrics, exemplars), FUSION also serves each store's own read API, unchanged, under its name:
| Prefix | Serves | Example |
|---|---|---|
/api/v1/fusion/prometheus/ | Prometheus' HTTP API: query, query_range, query_exemplars, series, labels, label/{name}/values, metadata, status/tsdb, status/buildinfo | /api/v1/fusion/prometheus/api/v1/query?query=sum(up) |
/api/v1/fusion/loki/ | Loki's: query, query_range, labels, label/{name}/values, series, index/stats, index/volume, index/volume_range, patterns, detected_labels, detected_fields | /api/v1/fusion/loki/loki/api/v1/query_range?query={service_name="web"} |
/api/v1/fusion/tempo/ | Tempo's: api/traces/{id}, api/v2/traces/{id}, api/search, api/search/tags, api/v2/search/tags, api/search/tag/{tag}/values (and v2), api/metrics/query, api/metrics/query_range | /api/v1/fusion/tempo/api/search?q={ status = error } |
After the prefix the path, the parameters and the answer are the store's own, so a client written for the store works with only its address and a bearer token changed: a Grafana datasource of type Prometheus, Loki or Tempo with the URL https://ikhnos.example/api/v1/fusion/prometheus (or /loki, /tempo) and an Authorization: Bearer <token> header, promtool, logcli. A POST with a form (how Grafana sends queries) is accepted on the query endpoints. A bad query gets the store's own error, in its own format. Loki's patterns come from its pattern ingester, which is enabled, and Loki and Tempo search accept a range of at most 31 days, as Prometheus does.
What is not mirrored is as deliberate as what is. Only read endpoints are served: nothing that writes (remote write, OTLP and Loki push, delete, snapshot), administers (reload, quit, flush, config, ring) or tails exists at these addresses - there is no refusal to bypass, the route is simply not there (404). The same authentication, rate limit (a request is a request), 30-second timeout, 16 MiB answer cap and failure rules as the rest of the API apply, and a store's own text for a failure of the store (as opposed to a mistake in your query) is not passed on.
Who may use it. The mirror forwards a query the caller wrote, and a query written by hand cannot be narrowed to a namespace or a cluster without understanding it, so it is for an administrator (a session or a personal access token) or a FUSION token with no namespace or cluster limit, for the signal in question (prometheus needs metrics, loki needs logs, tempo needs traces). A token that is limited keeps the structured calls above, where the limit is enforced; on the mirror it is refused with a 403 that says so. The token is what says that this caller may read what FUSION collected; the stores themselves are never exposed.
The fused trace
curl -H "Authorization: Bearer $TOKEN" \
  "https://ikhnos.example/api/v1/fusion/traces/0af7651916cd43dd8448eb211c80319c?fused=true"
The answer is the trace (traceId, start, end, durationMs, services, spanCount, errorCount, roots) with:
spans, in start order, each with itsparentSpanId,depth,service,namespace,pod,status,attributes,events, aresourcekey,logs(the log lines that carry this span's id) andmetrics: the points of its resource's series that fall inside the span's own time, widened byspan_padeither side, each series with itspointsand amin,max,avgandlastcomputed over just those points. A series with nothing in a span's window is left off that span.resources, one per service-in-a-pod, each with itsmetrics: the series saved for the same service and namespace (what the application itself reported) and for the same pod and namespace (what was reported about the pod), over the trace's time plus a margin, each aspointsof[unix seconds, value]and amin,max,avg,last.logs: how many lines were found (total), how many landed on a span (matched), andunmatched, the lines that carry the trace id but no span id or the id of a span this read does not have.joins: in words, how each requested signal was tied to the trace. Logs areexact(the record carries the ids); metrics areassociated, not proven.sources: for each oftraces,logsandmetrics(andcontextLogsandsystemLogswhen asked for), one ofok,not requested,not allowed(the token's scope does not include it),unavailable(the store could not be reached) orerror;warningssays why. A call to a store is cut off after 10 seconds, inside the request's 30, and a store that is too slow (the 504 names it) degrades only its own part toerror: the rest of the read comes back. A store that is down does not fail the read: the trace comes back and the missing part is named. Only a trace that cannot be read at all fails.
pad (the margin around the trace, default two minutes, at most an hour), span_pad (the margin around each span when its metrics are cut out, default 30 seconds, at most an hour: samples arrive every 30 to 60 seconds, so a span of a few milliseconds would often have none without it), metric (a regular expression over metric names, default all), max_logs (default 500, at most 2000), max_series (per resource, default 15, at most 100) and points (per series, default 60) shape it. A trace returns at most 5000 spans, and says when it had more. The spans of one fused read carry at most 20000 metric points between them (overlapping spans of one pod repeat the same samples); past that a span keeps each series' summary but not its points, and warnings says so. The per-span metrics are cut from what was already read for the resource, so they cost no extra store call.
Choosing what it carries
fused=true alone is include=logs,metrics. Giving include (a comma-separated list) says exactly what to join, and implies fused=true; fused=false with an include is refused rather than guessed at.
include | What is joined | How |
|---|---|---|
logs | The lines that carry the trace's id, each on the span whose id it carries. | Exact. Only the trace's own services are searched, not every service in the window. |
context_logs | For each resource, the lines it wrote around the trace that carry no trace id (the connection pool warning that came just before the failure). On resources[].logs, oldest first, max_context_logs per resource (default 50). | Associated: same service, namespace and pod, in the trace's window. |
system_logs | The lines of the system namespaces (system_namespaces, default kube-system) on the nodes the trace's pods ran on, in systemLogs, max_system_logs of them (default 100). One read per node, at most five nodes. | Associated: same node, in the trace's window. A token whose namespaces exclude the system ones gets a warning, not a read. |
metrics | The series of each resource, and of each span's own time. | Associated. metric_scope says whose: app (what the service reported), pod (what was reported about its pod) and node (series that name the node and no pod). Default app,pod. |
all, none | Everything above; or nothing, which is the trace alone, shaped by the options below. |
The same options narrow or shape the answer:
log_severity(errororerror,warn) andlog_containsapply to every log read of the fused object, so a read for failures can leave theinfolines out.span_service,span_statusandspan_min_durationreturn only the spans that match, for a long trace of which you want the failing part. The trace's own totals (spanCount,errorCount) stay those of the whole trace,spansOmittedsays how many were left out, andlogs.onFilteredSpanshow many of the matched lines sat on them.omit=attributes,eventsleaves the span and resource attributes, or the span events, out; most of a large trace's bytes are these.pad,span_pad,metric,max_logs,max_seriesandpointsare as below.
Your own PromQL, topology and changes in the fused object
These are added to the fused read (GET /traces/{id}?..., GET /traces?fused=true, POST /traces/batch) next to logs and metrics. Each reports itself in sources, joins and warnings like the rest.
Your own PromQL (promql)
promql=<name>=<expression>, repeated for up to five queries (in a batch body: an object of name to expression, or a list of name=expression strings). Giving promql implies fused=true; with promql alone, only your queries are added (no logs or metrics unless you also give include).
A query may name the resource it is read for: ${service}, ${namespace}, ${pod}, ${node}, ${cluster}. Such a query is evaluated once per resource of the trace with its values filled in, and the series sit on that resource (resources[].queries). With promql_spans=true they are also cut to each span's own time (plus span_pad), the same way metrics are (spans[].queries). A query that names none of them is evaluated once over the trace's time and sits in queries on the fused object. ${trace_id} and ${range} (the window's length as a PromQL duration, such as 154s) are available to both kinds; ${service:re} is the value escaped for use inside a regular expression; $${ writes a literal ${.
GET /api/v1/fusion/traces/<id>
      ?promql=errors=sum(rate(http_server_errors_total{service_name="${service}",k8s_namespace_name="${namespace}"}[1m]))
      &promql=cluster_load=avg(node_load1)
      &promql_spans=true&promql_pad=10m
| Parameter | Meaning |
|---|---|
promql_spans | also cut per-resource results to each span |
promql_step | seconds between points (default: chosen from points, at least one second) |
promql_pad | window around the trace for these queries (default pad, at most one hour) — a rate(...[5m]) over a 200 ms trace needs more than the default |
promql_services | evaluate per-resource queries only for the resources of these services |
max_series | the most series per query result |
Rules worth knowing:
- Only a caller whose access is not limited to certain namespaces or clusters, and whose signals include
metrics, can run queries. Anyone else getssources.promql = "not allowed"and a warning; the query never reaches Prometheus. This is the same rule asGET /metrics/query: PromQL cannot be narrowed safely without parsing it. - A value is substituted only if it is made of letters, digits and
_ . : / @ + - = , space(at most 253 characters). A service or pod name with a quote, a backslash, a brace or a control character is not substituted; that resource is skipped and the warning says why. Telemetry names are data from outside, so they cannot change the shape of your query. - A resource that lacks a value the query names (a service with no pod) is skipped, and the warning names it.
- Identical expanded expressions are evaluated once, whatever the number of resources or queries that produced them. One read evaluates at most 60 distinct expressions.
- A query that Prometheus refuses fails alone: its result carries
error, the other queries and the trace come back, andsources.promqliserror. - Like
metrics, the join is associated, not proven: a metric sample carries no trace id.
What Ikhnos knows (include=topology, include=changes)
topology adds resources[].topology: the service as Ikhnos knows it (matched by name, namespace and cluster, falling back to its app label), the services and external addresses it was seen calling (calls) and the services seen calling it (calledBy). It is the topology as of now, not as of the trace, and says so in joins. DNS and system traffic is left out.
An empty namespace or cluster on either side is not a wildcard. A resource that matches more than one service is ambiguous: it gets no topology, a warning, and a sentence in joins saying so.
changes adds changes: events Ikhnos recorded about the trace's services, nodes, clusters, dependencies and applications (targetKind is cluster, node, service, dependency, application or agent) from changes_before (default 30 minutes) before the trace to pad after it — scalings, restarts, node and cluster events, each with its detail and cause when known. max_changes (default 50, at most 500) keeps the newest. Events are looked up by the ids of the trace's resources, not by name; a node's id comes from the current topology, so events of a node that has already left it are not found.
Neither is a token signal. They follow the token's namespaces and clusters: a token limited to namespaces sees only neighbours in those namespaces (and no external addresses), and only the events of services in them. include=all now includes both. If the server has no topology to read, sources says unavailable and the trace still comes back.
What the join rests on
The join is only as good as the instrumentation behind it, and it is worth saying where it can come apart:
- Logs to spans use the OTLP log record's own
trace_idandspan_id, which Loki keeps as structured metadata. An application that logs without its trace context (most do until the logging bridge of its OpenTelemetry SDK is turned on) has logs, and traces, and nothing that joins them. - Metrics to spans are placed by resource and by time, never by request. They use resource attributes that the FUSION chart promotes to Prometheus labels:
service.name,k8s.namespace.name,k8s.pod.nameand a few more. The authoritative list isfusionapi.Vocabularyin the server code; the chart side isprometheus.promoteResourceAttributesin the FUSION chart'svalues.yaml(and, for Loki, theotlp_configindex list). The join is "the same service, namespace or pod around the same time", not a causal link from one request to one sample: metrics do not carry trace ids. - Telemetry carries a
service.name, not an application. An application in Ikhnos (a group of services, made by a person or found by discovery) is a different thing, and telemetry does not carry it:/applicationslists the Ikhnos applications,/servicestheservice.names, and filtering by application resolves one to its services when you ask. - Clocks. Spans, log lines and samples are stamped by the nodes that produced them. The margin around the trace absorbs ordinary skew, not a node whose clock is minutes out.
Filtering by Ikhnos application
In Ikhnos an application is a group of services: a person made it, or discovery found it. The telemetry itself only says which service.name, namespace and cluster it came from, so FUSION does not stamp an application on anything. Instead application=<id or name> is resolved when you ask: the server looks the application up in what Ikhnos holds now, takes its services (by name, and by their app label when telemetry uses that as its service.name) and the namespaces and clusters they run in, and adds them to the query as ordinary filters. Edit an application in Ikhnos and the next read follows; nothing stored is rewritten. /api/v1/fusion/applications lists what you can name.
That is also the answer to "should the application name be stamped on the telemetry?": nothing needs it to be. The name is resolved at query time, so it is always the present membership, no collector has to be reconfigured or restarted when an application is edited, and history is not frozen under an old name. Stamping it in the central operator would need a static lookup there (a configuration change and a restart per edit), and the central operator cannot see which pod belongs to which application; the right place for it, if ever needed for tools that read Loki or Tempo directly, is the source, where the agent already knows the pod.
# the applications you can filter by, and what is in each
curl -s -H "Authorization: Bearer $TOKEN" $ADDR/api/v1/fusion/applications

# the services telemetry names, and which application each is in
curl -s -H "Authorization: Bearer $TOKEN" "$ADDR/api/v1/fusion/services"

# the failing traces of one application, the logs of the same application, the metric names it reports
curl -s -H "Authorization: Bearer $TOKEN" "$ADDR/api/v1/fusion/traces?application=Shop&status=error&fused=true&include=logs,metrics"
curl -s -H "Authorization: Bearer $TOKEN" "$ADDR/api/v1/fusion/logs?application=Shop&severity=error"
curl -s -H "Authorization: Bearer $TOKEN" "$ADDR/api/v1/fusion/metrics/names?application=Shop"
What it does and does not do:
- It narrows the lists, searches and metric reads (applications, metrics, logs, trace search). It is combined with the other filters and with the token's own limits, never widened by them: a token limited to one namespace sees only the part of the application in it, and an application none of whose services it can see answers
404, as if it did not exist. - It does not narrow reading one trace, or what a fused read joins around a trace you found. A trace of the application also passes through services that are not part of it, and cutting those away would hide the cause of a failure; the search finds the traces, and each is then read whole.
- It cannot be combined with a query you write yourself (
query,q, the PromQL routes): those are sent as written, so there is nowhere to add the application. Add its services to your own query (the list is in/applications) or use the join below. - Telemetry says which service it is from, not which application. When two members of an application share a service name in different namespaces, a same-named service in the application's other namespaces can show up too; this is exact when the names are unique across the application's namespaces. Where a member comes from: a discovered service a person put into the application, and one that discovery grouped into it and a person accepted (accepting a grouping suggestion creates the application and stores no membership, because the services' own labels are the membership, so FUSION reads that label from the topology, unless a person put the service in another application), are read from the live topology, so their cluster must be connected now; a service somebody wrote into Ikhnos by hand is taken from its own record (its name, namespace and cluster), since the topology only holds what agents saw. A member Ikhnos has an id for but cannot tie to either is left out and counted:
unresolvedMemberson the application in/applications, and the404for an application with no usable members says how many ('3 of its members are not in the live topology') instead of only 'has no services'. A deleted application is not listed. - An application with no services, or more than 500 service names, is refused.
- Its pods' own metrics are included. Pod and container metrics carry the name of the Deployment, StatefulSet or DaemonSet but no
service.name, so for metric reads the application's service names are also matched against those workload names (the same assumption the Grafana dashboard makes: a workload is named after its service). This applies only when you have not named aserviceyourself. - The list of applications is cached for ten seconds, so a burst of requests (a dashboard refreshing) reads Ikhnos' state once; an edit shows up within that time.
- Your own choice is separate from your rights. A token's namespaces and clusters are rights: they decide what you may see and are never widened.
application=(likeservice,namespaceandcluster) is a choice inside them. Reading one trace, a fused join and the trace roots a limited token must not see follow the rights only, so choosing an application never hides part of a trace you are allowed to read. include=topologyalso names, on each service, the applications it is in (applications).
From Prometheus, Grafana and other tools that read the stores directly
Those tools do not go through this API, so while FUSION is running the server writes one series into FUSION's Prometheus every minute:
ikhnos_application_info{application="Shop", application_id="app-1", service_name="cart", service_id="sv-3f9a1c0d2b44", k8s_namespace_name="shop", continuum_cluster_id="cl-1", member="cart/shop/cl-1"} 1
One series per service name of each application, with the labels the telemetry's own series carry for it. Select by application with the same filters the API adds, or join:
# the services of an application, as a selector
rate(http_server_duration_seconds_count{service_name=~"cart|cart-app|web", k8s_namespace_name="shop"}[5m])

# or let Prometheus do it: an application's series from the series it labels (one application at a time)
sum by (service_name) (rate(http_server_duration_seconds_count[5m]))
  * on(service_name) group_left(application)
  max by (service_name, application) (ikhnos_application_info{application="Shop"})
member is the service, the namespace and the cluster as one value (service/namespace/cluster; a part Ikhnos does not know is empty, not a wildcard). It exists so a selection can be exact: a join on on(service_name, k8s_namespace_name, continuum_cluster_id) keeps exactly the tuples of the members you chose, where filtering by service, namespace and cluster separately would also keep a service in a namespace it does not run in. The Applications dashboard's picker is built from it.
service_id is the id of the service in Ikhnos (sv-…), the id the API gives on an application's services and the graph uses for the service entity (system memory); member is its name/namespace/cluster key, which the graph stores as key. It ties a series to one service record, where service_name can be shared by services in different namespaces or clusters. It adds a label, not a series: the cap of 5000 series and the report of a truncation are as before. A join or selector on the other labels works as it did; one that matches the exact label set of this series needs service_id added or ignored (ignoring(service_id)).
The series is not telemetry: the Grafana dashboards leave it out of their counts, and it appears only while FUSION runs. It carries a series for each name a member's telemetry may use (its name and its aliases) in each namespace and cluster it runs in, so a count of the series is not a count of services. A member Ikhnos knows no namespace or cluster for is written without that label (the dashboards' namespace and cluster choices match those with .*, not .+). It describes the present: an application edited or deleted in Ikhnos changes the series within a minute (a removed one is gone after Prometheus' five-minute lookback), and its history is not kept. It is written only while FUSION is running, and the Grafana dashboard Applications reads it for its variables. A service in two applications makes the join many-to-many; select one application, as the dashboard does. Loki and Tempo have no such series: use the API's application=, or the service list from /applications in a LogQL or TraceQL selector.
Cluster links
GET /api/v1/fusion/links answers what the Sites screen shows, for a script, a dashboard or a decision engine: for each pair of clusters the organisation watches (the links of its settings; see cluster links), the latest loss in each direction, round-trip time, delay variation, path MTU and throughput, and when the probe and the throughput test last finished. It reads the continuum_link_* metrics with a fixed set of queries, shared for 15 seconds between all callers and the Sites screen, so polling faster than that only uses your rate limit.
curl -s -H "Authorization: Bearer $TOKEN" "$ADDR/api/v1/fusion/links?cluster=cl-eu-1"
{
  "pairs": [
    {
      "a": "cl-eu-1", "b": "cl-eu-2",
      "measuredBy": ["cl-eu-1", "cl-eu-2"],
      "rttSeconds": 0.0121,
      "lossAToB": 0.02, "lossBToA": 0,
      "jitterSeconds": 0.0006,
      "mtuBytes": 1420,
      "throughputAToB": 920000000, "throughputBToA": 870000000,
      "probedAt": "2026-10-14T09:41:07Z", "testedAt": "2026-10-13T22:10:44Z"
    }
  ],
  "at": "2026-10-14T09:41:30Z"
}
- Each pair appears once.
asorts beforeb, whichever way round the administrator entered the pair.lossAToB,throughputAToBand the other...AToBfigures are fromatob,...BToAthe other way. Both clusters of a pair measure towards each other, and the answer has already chosen between them, so count a pair once (not once under each of its clusters) and do not add the two clusters' figures together. measuredBysays whose series the figures are:a,bor both, in that order, and empty when FUSION holds nothing for the pair (the pair is still listed, with no figures). Where both clusters measured a figure the first cluster's is used and the second's only fills a gap;jitterSecondsis the larger of the two andmtuBytesthe smaller.- A figure FUSION does not hold is absent, never zero: a pair that is not probed has no loss, and one that asks for no throughput tests has no throughput. Loss is a fraction (0 to 1), times are seconds, throughput is bits per second.
clusterandpeerkeep only the pairs a cluster is in, or the one pair of two clusters.peerwithoutclusteris a400. A cluster that is in no watched pair gives an empty list, not an error.- What a token sees. The route needs the
metricssignal (without it,403). A token limited to clusters sees only the pairs whose two clusters it may read, and a pair outside that is not told apart from one that does not exist. The figures are read by the server with fixed queries and then filtered by cluster id, which is why a limited token can read them although it cannot send PromQL itself. A token limited to namespaces is refused (403, with the reason): link figures are measured between clusters and belong to no namespace, and a namespace limit hides all telemetry that carries none, as it does on the other metric reads, so an empty list would only mislead. Give such a consumer a token that limits clusters instead. - When FUSION cannot be read the answer is
503(504when it is slow); what the store said is not repeated.
The series behind these figures are ordinary metrics: read them over a range with metrics/range?metric=continuum_link_.*&category=system (a limited token sees only the series its clusters report).
Application topology
curl -s -H "Authorization: Bearer $TOKEN" "$ADDR/api/v1/fusion/applications/Shop/topology"
curl -s -H "Authorization: Bearer $TOKEN" "$ADDR/api/v1/fusion/applications/Shop/topology?at=now-3d&window=6h"
GET /api/v1/fusion/applications/{name}/topology (name is the application's id or name) answers who the application's services call and who calls them: the traffic between its members, its neighbours (services outside it that talk to it), the external addresses it reaches, and the recent changes recorded about it. Each link carries its traffic, and its origin and confidence are those of the application's group.
| Parameter | Meaning |
|---|---|
at | Read the topology as of this time instead of now (history). |
window | How far back traffic is counted. Default 24 hours, at most 7 days. |
noise | Whether links classed as noise are shown. |
- It follows the token's scope like
/applications: a limited token sees only the part of the application, and the links and neighbours, in its namespaces and clusters. An application none of whose services it can see answers404. - The answer is capped at 2000 links, 200 neighbours, 50 external addresses and 100 changes. When something was cut, the response says so.
History
at needs the temporal graph (Neo4j). Without it the endpoint answers 404 with "history is not enabled". The application has to exist and be visible now.
- Membership is read at the exact
at. The topology comes from the newest recording at or beforeat; its time is given assnapshotAt. A service that joined the application after that recording appears with an unknown status. - Traffic counters are merged from the recording, and the neighbours are one hop from the application over the dependency edges that were open at
at, each with its provenance. - The graph does not keep labels, so historical aliases and a neighbour's
applicationsare empty.
Categories: system, kubernetes, application
Every metric series, log line and span is about one of three things, and category= lets you ask for one: system is the host, the collectors and the network between clusters (node and process metrics, scrape health, energy, the collectors' own metrics, the continuum_link_* measurements of cluster links; logs of the host and node, which carry no namespace), kubernetes is the cluster's own objects (pod, container, node-condition and kube_* metrics; logs of kube-system, kube-public and kube-node-lease), and application is everything else: what workloads report about themselves. Give one or several, separated by commas (category=system,kubernetes); all three, or none, means no filter. An unknown value is a 400.
curl -s -H "Authorization: Bearer $TOKEN" "$ADDR/api/v1/fusion/metrics/names?category=application"
curl -s -H "Authorization: Bearer $TOKEN" "$ADDR/api/v1/fusion/logs?category=kubernetes&severity=error"
- A category says what a signal is about, not who owns it. A pod's CPU is
kuberneteswhichever application the pod belongs to;application=answers "whose",category=answers "what". They combine. - The API works it out when you ask, and the data is also stamped. Metrics are sorted by the family of their name (
system_*,process_*,node_*,kepler_*,dcgm_*and upper-caseDCGM_*,otelcol_*,continuum_link_*,scrape_*,up,target_infoare system;k8s_*,container_*,kube_*are kubernetes; the rest are application). Logs are sorted by namespace (none is system; the three namespaces above are kubernetes). The answer says which category each result was put in:categoryon every series and log line, andcategories(a name to category map) beside the names of/metrics/names. Because the API decides it from the name or the namespace, a rule changed in a release applies to old data too. Data that arrives after the central operator is upgraded also carries the category as a label of its own,ikhnos_categoryin Prometheus and Loki (a pipeline filter in Loki:| ikhnos_category="kubernetes") andresource.ikhnos.categoryin Tempo, set at the central operator by the same rule (a chart test keeps the two the same), so Grafana, PromQL, LogQL and TraceQL can filter on it without name patterns:sum by (k8s_namespace_name) (k8s_pod_cpu_usage{ikhnos_category="kubernetes"}). A sender cannot choose its own: the value is always replaced. Two differences from the API on data stamped this way: a span with no namespace isapplication(the API leaves it out, since the trace store cannot match what is not there), and nothing is stamped on data stored before the upgrade, so for a past range the API'scategory=is the one to use. The application is deliberately not stamped: it is a grouping people change, so it is looked up when you ask (application=, or the join on the info series below). - Traces have two categories, not three. A span is not a host signal:
category=kubernetesselects spans of the system namespaces,category=applicationthe others, andcategory=systemis a400rather than an empty answer. - It cannot be combined with a query you write yourself (
query,q), for the same reason asapplication=.
Reading many traces
# the ten newest failing traces of one service, each in full
curl -H "Authorization: Bearer $TOKEN" \
  "https://ikhnos.example/api/v1/fusion/traces?service=checkout&status=error&fused=true&limit=10&include=logs&omit=events"

# these specific traces, with the options stated once for all of them
curl -X POST -H "Authorization: Bearer $TOKEN" -H "Content-Type: application/json" \
  -d '{"ids": ["0af7651916cd43dd8448eb211c80319c", "..."], "include": ["logs", "context_logs"], "log_severity": "error,warn"}' \
  "https://ikhnos.example/api/v1/fusion/traces/batch"
GET /traces?fused=true searches and then reads every hit as a fused trace (a smaller page: 10 by default, at most 25). POST /traces/batch takes up to 25 ids and every fused option in the JSON body (lists as arrays); options given in the query string are defaults the body overrides. Both answer {"results": [...], "summary": {requested, ok, failed}} with the results in the order asked (the search also returns its traces). Each result has its own status: one trace that is missing, malformed or hidden from the token does not fail the others.
Streaming. With stream=true (or Accept: application/x-ndjson) the answer is newline-delimited JSON, flushed as it goes: for a search first a line with the hits, then one {"type": "result", ...} line per trace as soon as it is read, in the order they finish, then {"type": "summary", ...}. A caller can start on the first trace while the rest are still being read, and if the 30 seconds run out, the traces not yet done come back as lines with status 504 and the closing summary still arrives.
Why it does not block anyone. Three limits work together. One request reads at most three traces at once. Every store call a bulk read makes waits in a bulk lane of five of the server's eight store-call slots before it takes one, so any number of bulk requests together leave three slots free and a single read never queues behind them. And a bulk read of n traces costs n reads against the caller's rate limit (600 a minute), so it cannot be used to go round it. When the 30 seconds end, the traces not yet started come back with status 504 and a message, instead of the request failing as a whole, and the summary is still written.
The API page and the OpenAPI description
/api/v1/fusion/openapi.json is an OpenAPI 3.0 description of every route, parameter and answer, and /api/v1/fusion/docs is a page built from it: the routes grouped, each with a form for its parameters (checkboxes for include, omit and metric_scope), a field for your token (kept for the browser session only; leave it empty to use your signed-in session), a Send button that calls the real API and shows the status, time and size, a Copy as curl, and, for stream=true, each line as it arrives with the time it arrived at. It also shows the shape of each object (the fused trace, a span, a resource, a log entry). The page is served with a policy that lets it run only its own script and call this server; it loads nothing from anywhere else.
The description is generated from the same table the router is built from, so a route cannot exist without being described, and a test checks that every query parameter the handlers read is described and that every route is served. Point a client generator at openapi.json to get a typed client.
Limits and errors
Parameters are checked. A route answers 400 for a parameter it does not take (the message lists the ones it does), and for two that cannot be used together: a raw query or q is sent to the store as written, so the filters beside it would silently do nothing, and name overrides metric. The options that shape a fused read (include, margin and so on) need fused=true on the routes where a fused read is optional. The native /prometheus, /loki and /tempo routes forward whatever they are given. The API page greys out a parameter that the ones you have filled in rule out, using the same table (x-excludes and x-needs-fused in the OpenAPI description).
A store answer larger than 16 MiB is refused (narrow the range or the filters). A request takes at most 30 seconds, and a call to one store at most 10 of them. The server keeps at most 8 calls to the stores in flight at once, across all callers, and bulk reads no more than 5 of them. A fused read looks metrics up for at most 20 resources of a trace, and clamps the window it searches to 30 days (a trace longer than that covers its last 30 days); either is reported in the read's warnings. When a store itself fails, the caller is told which store and the status, not the store's own error text. Failures use the usual statuses:
| Status | Meaning |
|---|---|
| 400 | A parameter or a filter was not valid (the message says which), or a store refused the query. |
| 401 | No credential, or one that is unknown, revoked or expired. |
| 403 | The caller's scope does not include this (a signal, or a raw query). |
| 404 | No such trace or application, or none that this caller may see. |
| 422 | The answer was larger than this API returns. |
| 429 | Too many requests from this caller. |
| 503 | The store could not be reached: FUSION is off or still starting. Turn it on from the FUSION page, Settings tab. |
| 504 | A store took too long (the message names it). |
Not in this release
There is no push: a caller polls (a bulk read can stream its results, but each request is still a request). There is no write path of any kind through this API (FUSION is filled by the central operator and nothing else). Token scopes name namespaces and clusters, not individual services or label sets. A limited token's application list is a sample, not a census: for logs it comes from the most recent log lines (Loki cannot filter a label-value call by structured metadata), and for traces from the services of its 200 most recent traces (Tempo's tag-values call does not promise to honour a scope), so a quiet service can be missing from it.