Regional operators
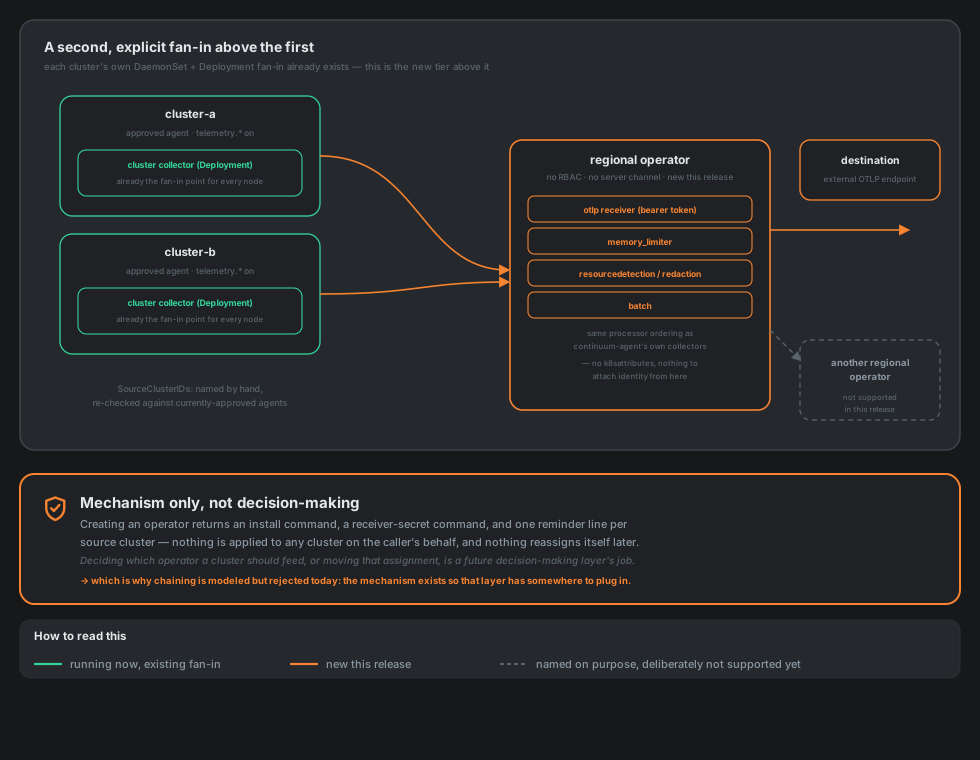
Telemetry intent covers the first fan-in: one Helm release already reaches every node in a cluster, because a DaemonSet is Kubernetes' own fan-out primitive, not something this project reinvents. That page's own "Multi-cluster" section names the fan-in that stops there — each cluster's release is independent, and nothing aggregates what several clusters produce. A regional operator is the second, explicit fan-in tier that closes that gap: a standalone collector that receives what a set of already-approved clusters already export, and re-exports it as one stream.
What a regional operator is
Architecturally, a regional operator is the same idea as a local operator's own collectors — an otel/opentelemetry-collector-contrib deployment with a config the server generates — just pointed the other way. A cluster's telemetry collectors export OTLP outward; a regional operator receives it. There is no gRPC/mTLS channel to the Ikhnos server at all, ever (the one optional exception is a content-free heartbeat, off unless you turn it on) — the same one-way boundary Telemetry intent's "One party, not two" describes for a single cluster's telemetry holds here too, just one layer up. The server never sees the data a regional operator relays (with one deliberate exception: if you choose FUSION as the destination, the server can read back what FUSION stored, for callers you give a token), only the record of the operator's own existence and scope — and, if the heartbeat is on, when the operator last said it was alive.
It needs no Kubernetes API access of its own, and gets none: the chart's serviceaccount.yaml renders a ServiceAccount with automountServiceAccountToken: false and nothing else — no ClusterRole, no ClusterRoleBinding, confirmed by the chart's own render tests. With renew.enabled the chart also renders a namespaced Role that lets the certificate-renewal sidecar get and update the operator's own named TLS Secrets; only that container gets the account's token, and there is still no cluster-wide rule. That follows directly from what it does: it only relays and re-processes telemetry that already arrived over OTLP, so it never needs to watch this cluster's own object graph the way k8sattributes does for a cluster's own collectors.
What gates its receiver is the client certificate alone, for every operator the server creates (Operator.ReceiverAuth = mtls, exposed as receiverAuth in the admin API). The install command sets receiver.tls.enabled and receiver.tls.mtls, so the collector only accepts a source cluster presenting a certificate signed by that operator's own private CA, and sets receiver.auth.enabled=false: there is no receiver bearer token to mint, store or show, and the per-agent command an agent is pointed at the operator with (/telemetry-intents/{id}/command) needs only that certificate. The command also sets receiver.requireAuth=true, so the chart refuses to render if the certificate requirement is ever lost with no bearer gate in its place. The operator's own CA. Creating an mTLS operator also mints a private issuing CA for it (pki.CA.NewOperatorCA: a fresh ECDSA P-256 key and a self-signed certificate, CN=Ikhnos operator CA <operator id>, valid five years, able to sign leaf certificates only). That one CA signs the receiver's own server certificate and every client certificate the operator's source clusters present (IssueOperatorClientCert signs with it again on every reissue, audited as operator-client-cert-reissued with ca=operator). Its certificate is the ca.crt of the receiver's TLS Secret (client_ca_file and trust anchor) and of every agent-side Secret the commands print, so the receiver trusts exactly one CA and that CA is not the org CA: a certificate issued for another operator of the same organisation, or by the org CA itself, fails the handshake. The CA's private key is stored on the operator row (client_ca_cert, client_ca_key, schema 11), sealed exactly like the org CA key (argon2id + AES-256-GCM under the same passphrase; with no passphrase it is plain and logs the same warning), and is erased when the operator is revoked; deleting the operator drops the row. The API says which scope applies with clientCaScope on the operator: "operator" (this), "org" (below) or "" (a bearer operator). Within one operator the CA, not the subject, is the gate, so any certificate it signs is accepted, whatever name it carries; the CA key is never handed out, only certificates signed with it. The CA is not renewed: after five years the operator must be revoked and recreated, and a leaf is never issued to outlive it.
Legacy scope. A new operator is always mTLS with its own CA; the org-CA scope and the bearer mode below exist only for operators already stored. An mTLS operator created before per-operator CAs has no CA of its own (clientCaScope: "org"): its receiver was installed trusting the server's org CA, which every organisation on the server shares and which verifies the certificate chain rather than which operator it was issued for, so any client certificate that CA issued is accepted by it. That is the weaker scope. It keeps being reissued from the org CA, because its receiver cannot be moved to another CA without reinstalling, and the fix is to create a new operator. Operators created before this keep bearer (receiver.auth.enabled=true; the server holds only a hash of that token and cannot recover it). A bearer token, where there is one, was minted once, at creation, and shown exactly once, the same convention an enrollment token follows; anyone who needs the value again has to create a new operator.
The two fan-ins, as one picture
Read the two tiers together and there's really just one shape, applied twice:
- Nodes into a cluster. Existing, automatic, and covered in full by Telemetry intent. Kubernetes' own DaemonSet scheduling puts one collector pod on every matching node the moment it joins; the cluster's single
Deploymentcollector is where that per-node output, plus the cluster's own application/cluster-scoped signals, already converges into one export point. This has always been automatic and requires no separate decision. - Clusters into a regional operator. New, and explicit rather than automatic: a person names a set of
SourceClusterIDsby hand when creating the operator, and the server checks that every one of them is currently the cluster of an approved agent in the organisation — the same "already-approved clusters only" rule that governs everything else a regional operator touches, re-checked server-side even though the UI's own picker only ever lists approved clusters to begin with.
The important distinction: a regional operator aggregates what a cluster already exports as a whole — the union of that cluster's own DaemonSet and Deployment collector output, whatever signals its own telemetry intent has turned on — not individual nodes directly. It operates one level up from where local operators already converge, never below it. There is no path from a regional operator back down into a specific node's data; the cluster's own collector is where that shape is lost, by design, on the way out.
How one is created
A regional operator is a real, immediately-persisted record (store.Operator), not a pending request. That's a deliberate difference from agent enrollment: an agent starts in a pending state and needs a person to approve it before anything is trusted; a regional operator has no equivalent approval step, because its own creation already required naming a set of already-approved clusters — the trust decision was made when those clusters were approved, not again here. The receiver's certificate material (or, for a bearer operator, its token) is minted at the same moment the record is created, not held back for a later step.
Destination also models chaining one regional operator into another (DestinationKind: "operator"), and the server rejects it outright in this release — creating or updating an operator with that destination kind fails validation. This is named as a real, deliberately deferred capability, not an oversight: this release builds the mechanism for a two-tier fleet (clusters feeding one regional operator that exports onward), and a fleet of regional operators feeding each other, or reassigned dynamically, is exactly the kind of decision a future decision-making layer should make on purpose — not something to bolt on ahead of that layer existing.
Where other clusters reach it
An operator's receiver is a Service, and a Service only resolves inside its own cluster. Anything elsewhere (another operator, or a cluster's own telemetry) needs an address it can dial, and that address is something only the person who exposed the Service knows. So Ikhnos asks for it once and then remembers it:
- Creating the operator asks how far it must reach. The last step of the dialog shows three choices in the open: Node port, preselected and marked recommended because it works on any cluster; Load balancer, which needs a load balancer provider and otherwise waits for an address forever; and This cluster only, which changes nothing. Node port and load balancer add
--set service.type=...to the install command, so the Service is exposed by the install itself and nobody patches it by hand afterwards. A node port opens one port, 4317, on every node of the cluster; the receiver still demands a client certificate. If you already have your own Ingress or DNS name in front of it, choose "This cluster only" and use that. - Recording the address. After the operator is running, the created screen (and the Reachable at button on the operator's row, any time later) first lists the addresses Ikhnos found for the operator, and Use puts one in the field. They come from what the agent in the operator's cluster already reports: a load balancer's address, an external IP, or the node port on each ready node (the nodes running the operator's pod first), plus the address already recorded. With the agent's node probe on, each node also offers the addresses on its own network interfaces, so a mesh address (WireGuard, Tailscale, Netbird and the like) and a second LAN appear beside the one Kubernetes knows. Each is labelled mesh, private network or public, with the interface it was read from, and listed in that order: private and mesh first, public last. Addresses that mean something only inside the cluster (a pod range, a CNI bridge,
docker0,kube-ipvs0) are never offered. A node port is open on every address of its node unless kube-proxy was told otherwise (nodePortAddresses), so a mesh address on the node usually works with no rule of Ikhnos's own; the Test button below is how to be sure. The dialog also says, in a sentence, when it could offer more: that no node reports its interfaces (turn the probe on), or that the cluster already runs MetalLB, kube-vip or the Tailscale operator, whose address for the operator stays put when a node goes away. Nothing has to be read off the cluster by hand. When no agent has reported the operator yet, or its Service has no address outside the cluster, the dialog says so, and the onekubectlline below still reads the address the Service was given. Either way the result is ahost:port; typing one is always possible. A list entry is where the operator can be reached, not a promise that a particular cluster can reach it. The server checks it (a host and a port; nothing that could not be reached from another cluster, such aslocalhostor a loopback address) and audits the change asoperator-address-changed. - Everything that points at the operator now uses it. The install command of another operator, a cluster's telemetry intent command, and the per-signal routes all dial the recorded address. Before one is recorded they use the in-cluster name, and the destination step of the telemetry wizard says so ("No address is recorded for this operator...") rather than handing out a command that cannot work from another cluster. The central operator in front of FUSION works the same way: its row has the same Reachable at button, and you expose its Service (
fusion.central.service.type) first.fusionControl.centralAddressin the server chart still works as the starting value, but an address recorded on the screen outranks it and needs no redeploy.
Exposing the central operator. The gateway is part of the server's own install, so no create command carries the choice. While its Service is only open inside its cluster, the address picker shows a card instead of an empty list, with the kubectl patch svc line for it (the real Service name and namespace filled in; a switch picks NodePort or LoadBalancer). The patch changes the Service in place: no pod restarts, its cluster address stays. A later helm upgrade puts the type back to the chart's value, so the card also says to set fusion.central.service.type to match in your Helm values. Once the Service has a node port or a load balancer address, the list shows the load balancer, and the nodes' addresses on that node port. When the load balancer's address is itself one of the cluster's nodes' addresses (k3s's built-in load balancer, which listens on the Service port on its node), the nodes' addresses are also offered on the Service's own port, since the node answers there too. That is read from the evidence, the address being a node's own, and not assumed from the kind of cluster: with MetalLB or a cloud load balancer the port is not open on the nodes and is not offered there. The same rule applies to every operator's address list. The nodes come from the cluster the gateway runs in, which is the server's own. The server chart passes that cluster's identity (the UID of its kube-system namespace, read with Helm's lookup; clusterId in the values where lookup cannot run) and the server picks the agent registered in the cluster with that identity. Someone can also choose the cluster in the address picker, which overrides the install. When neither is set, the server works it out from an agent that reports a workload in its namespace and, failing that, from the agent whose cluster has a node with the load balancer's address (k3s's built-in load balancer hands out the node's own). The nodes' addresses need no agent in that cluster. The server chart runs its own node probe (nodeProbe.enabled, on by default): the same read-only DaemonSet an agent's chart offers, on every node, in the host network namespace so that it sees the node's real interfaces. It reports to a receiver inside the server over the cluster network, each report signed with a secret the chart generates in the same release and keeps across upgrades, so nobody enrolls, approves or types anything. Those probes sit in the server's own cluster by construction, so their reports also settle which cluster that is when nothing else did. A real agent in the cluster always outranks them: an address its own probe reports is never replaced, and the server's probes only fill in nodes the agent has no interface addresses for. A node whose probe has been silent for three intervals is no longer listed. The probes give addresses only; readiness, pod ranges and topology still come from an agent. A namespace that enforces the Pod Security baseline or restricted profile refuses hostNetwork: the probe pods then do not start and the rest of the install is unaffected, and a cluster with neither probes nor an agent is said so on the card, which offers to connect the cluster.
Which address a sender dials. The recorded address is the one every sender falls back to, but the sender is the one that knows which of the operator's addresses it can reach: a node address on the operator's own network answers from a cluster on that network and from nowhere else. So the choice is made on the sending side. In the destination step of the telemetry wizard, under the operator picked as the destination, Address this cluster dials lists the recorded address and the addresses found for the operator (see item 2 above), and also takes one typed in. The choice is stored with that destination (the address field of a telemetry intent's destination, and of each per-signal route, so a signal type can use a different one) and is held to the same rules as a recorded address. The generated command dials it; the operator is still verified by its stable name, so nothing about the operator or its certificate changes, and another cluster sending to the same operator keeps its own choice. Leaving it unset means the recorded address, exactly as before. A private address chosen this way carries no "a cluster elsewhere cannot reach it" warning, because that is the point of choosing it.
Trying an address from the sender. Whether an address works depends on where it is dialled from, and only the sending cluster knows. When the wizard knows which agent will send, each address in Address this cluster dials (and one typed in) has a Test button. It asks that agent, over its existing stream, to time a TCP connection to the address (POST .../agents/{id}/address-tests, administrators only, audited as address-test-started). The agent connects and closes: it sends and reads nothing, and the server adds the address to the agent's targets for ten minutes, a few seconds after which the agent reports what it found. The result is read back (GET .../agents/{id}/address-tests) and shown on the row as reachable from that cluster with its round-trip time, or as no connection. The same safeguards as connection timing apply: loopback, link-local (cloud metadata) and Kubernetes control-plane ports are refused, at most six tests are held per agent, they are refused while connection timing is paused for the cluster, and a test result is never added to the measured paths on the topology. A reachable result means the address answers on its port from that cluster, not that the operator is what answers; the certificate is checked, against the operator's stable name, when data is sent.
Who sends here, and why one is not getting through. An operator's row has Clusters sending here (administrators only; GET .../operators/{id}/senders). It lists every active telemetry intent that names the operator, for each: the address it dials and who chose it (the sender itself, the one recorded for the operator, or the operator's in-cluster name when none is recorded), which signal types go there, and how delivery goes, read from the export counters the sending agent already reports. Where a sender is failing, it says which end the evidence points at. The reading is deliberately made from what the server holds, never by dialling anything: the error the exporter reports (a timeout, a refused connection, a name that does not resolve, a certificate, a credential), whether the operator is reporting its own health, and whether other senders are exporting to the same operator. A cluster that times out while another cluster exports to the same operator is the sender's network or address, and the message names the address that works for the other one; a certificate error while others work points at that cluster's own client certificate; an operator that has stopped reporting while nobody gets through points at the operator first. When none of that settles it, it says so and points to Test. A sender whose agent is not connected is reported as that, not as a fault of either end.
Noticing that an address stopped answering. An address can change under a running install: a node is replaced, a Service is recreated with a new node port, a mesh peer is renumbered. Every few minutes the server repeats the Test above on its own, from each connected sending cluster, for the addresses its senders dial (the one a sender chose, else the one recorded; an in-cluster name is not tested). A cluster is re-tested when its last result is a quarter of an hour old, only while it is connected and connection timing is not paused, and it never takes room from a person's tests. It is the same plain connection, so it is not audited (nobody asked for it) and does not appear in a person's list of tests. The last result is kept for an hour and shown in Clusters sending here next to the address (answers from there, or no answer from there). It feeds the reading too: an address that nothing answers at, while the sender is not exporting, is reported as that cluster's address or path before any exporter has failed, and a failing sender whose address still answers is told the failure may be passing.
The central operator is reached the same way. Everything above applies to FUSION's gateway (the central operator), with three differences in where the facts come from. The sender's choice of address, the Test button and the senders list are all offered for it, and a sender that dials FUSION at an address of its own keeps that address in its telemetry intent exactly as it does for a regional operator. Its candidates are read from the gateway's Service by the server itself (a load balancer's address is offered even where no agent runs in the server's cluster) and, when an agent does run there and reports the gateway's Deployment, from the nodes' node ports, as for any operator. And its health is FUSION's own state, since the gateway has no heartbeat: when FUSION is off, still starting or reports a problem, a failing sender is told that first (FUSION is off, nothing is accepted), unless another cluster is getting through, which is stronger evidence that the path is what is wrong. The gateway has no certificate row to renew from, so a refused certificate is not pointed at one.
What a sender in the same cluster dials. The Service the chart creates is named after the release the install command uses, so a regional operator op-abc is reached at op-abc-regional-operator.continuum-system.svc:4317 (the chart adds -regional-operator unless the name already has it). Its certificate carries that name as well as the stable one below, and every generated command sets serverName to the stable name, so the same command works whether the sender dials the Service name, a load balancer, or a recorded address.
Why the address can change without touching a certificate. The operator's receiver certificate is signed for its stable in-cluster names (<id>.continuum-system.svc and its variants), not for an address that may not exist yet when the certificate is made (a load balancer's IP is assigned after install). A caller that dials the recorded address therefore verifies the certificate against the stable name, with the exporter's server_name_override (the serverName value under telemetry.export.otlp.tls, each route's tls, and the operator chart's export.otlp.tls; Ikhnos's commands set it whenever they use a recorded address). The mutual-TLS requirement is unchanged: the address is only where to knock, and trust still comes from the operator's own CA. Moving an operator to a new IP or DNS name is one edit of the recorded address and re-running the commands that point at it, with no certificate to reissue.
What an exposed Service publishes, and keeping it private. A LoadBalancer or NodePort Service publishes only the OTLP/gRPC port (4317), the one clusters elsewhere use; the OTLP/HTTP and self-metrics ports stay on the in-cluster form only. The receiver still demands its client certificate (or token), but a public address is reachable by anyone, so for a private network set service.annotations (an internal load balancer is an annotation your cloud defines) and service.loadBalancerSourceRanges. If you turned on the receiver's NetworkPolicy, allow the callers' addresses in receiver.networkPolicy.allowedIngress as well. The port in "Reachable at" may be left out: it is 4317. Changing the address updates the commands Ikhnos hands out from then on; a cluster that already points at the operator keeps its old address until you run its command again.
Three ways to give it an address. Ikhnos needs a host:port that other clusters can dial, and does not care how you got it:
- A load balancer or node port from the install. Pick it when you create the operator; the row then says "exposed through a load balancer, address not recorded yet" until you paste the result of the
kubectlline into Reachable at. - Your own Ingress or DNS name. Keep "This cluster only", put an Ingress or Gateway with TLS passthrough in front of the Service (the receiver does its own mutual TLS, so it must not be terminated in front), and record that name. Passthrough can route by the certificate name
<id>.continuum-system.svc, which every caller already sends, so one entry point can serve many operators. - A mesh or cluster-to-cluster network such as Tailscale, Netbird, Submariner, Cilium ClusterMesh or Liqo. Use the name or IP the mesh gives the Service. Nothing here knows or needs to know the network is an overlay: the certificate is checked against the stable name, so the network is only the pipe.
Checking it. Typing an address in Reachable at shows a one-line openssl check to run from a machine in the cluster that will send. It lists the names on the certificate found at that address, which must include DNS:<id>.continuum-system.svc. No output means that machine cannot reach the address; a different name means the address leads somewhere else. Ikhnos does not dial the address itself, because the server is usually not on the network the senders are on, and a server that connects to an address an administrator typed is a risk in its own right.
Recording an address does not change a source cluster that is already configured: nothing is pushed to a cluster by Ikhnos, so clusters already pointed at the in-cluster name keep working exactly as before until their command is run again.
What's rendered
The continuum-regional-operator chart's processor pipeline follows the exact ordering discipline continuum-agent's telemetry collectors already use — memory_limiter always first, resourcedetection/redaction next if enabled, signal-specific processors (probabilistic_sampler for traces below 100%), the extraProcessorNames escape hatch, batch always last — so the same processor-editing UI the agent's telemetry panel already has works for this chart completely unmodified. The one deliberate omission is k8sattributes and any namespace scope filter: a regional operator never watches a Kubernetes object graph of its own, so there is nothing for either of those to attach identity from.
Identity and labels on what it forwards
Every operator stamps who it is on everything that passes through it: continuum.operator.id and continuum.operator.name, plus the labels given when it was created (a region, an environment; at most 8, each a name and a short value, never under the reserved continuum. prefix). They are written by one processor, resource/operator, which sits after the extraProcessorNames escape hatch and immediately before batch, with action: upsert — the same placement rule resource/continuum has on the agent side, so nothing a user's own processor sets, and nothing an upstream agent already put on the record, can override them. Together with the agent's continuum.org.id, continuum.cluster.id and continuum.intent.id, a record arriving downstream says which cluster produced it, under which intent, and through which operator it was aggregated.
The identity and labels reach the chart as one --set-json operator=… value in the generated install command, quoted for the shell so a name or value containing a quote cannot break out of it. They are stored on the operator record (schema version 12) and are fixed at creation: they describe the install that is already running, so editing them on the server could not change what that collector stamps. An operator created before labels existed reads back with none and, with no operator value set, renders a collector configuration byte-for-byte what it was before.
Optional heartbeat: online, offline, last seen
By default the server cannot tell whether a regional operator is alive: the operator never contacts it, so a record that says "active" says only that nobody revoked it. An operator can opt in to a heartbeat so the UI can show online, offline and last-seen. It is off unless turned on — with heartbeat.enabled left at its default false, the chart renders exactly what it rendered before the feature existed (a chart test compares the full default output against a golden copy), and the operator never contacts the server.
What is sent. Every heartbeat.intervalSeconds (60 by default; the chart's schema allows 10 to 60) the operator's own collector probes its own health_check endpoint on 127.0.0.1 — the same endpoint its liveness probe reads — and a dedicated metrics pipeline POSTs that one result, the collector's own httpcheck.status, to heartbeat.url over HTTPS. That pipeline has one receiver (the probe), one processor (a filter that keeps only that metric) and one exporter (otlphttp/heartbeat), and shares none of them with the relaying pipelines, which are unchanged. The heartbeat carries no telemetry: nothing you relay, no logs, no traces, no cluster or workload data, nothing from export.* or receiver.*. The server drains and discards the request body (capped at 1 MiB) and records only that an authenticated request arrived, and when. A heartbeat shows that the operator's collector is running; it does not show that the operator's own destination is reachable.
Its credential. The heartbeat has its own secret, minted separately from whatever gates the receiver (a client certificate, or a bearer token for an older operator) and never reusing it: that gate authenticates traffic into the operator, the heartbeat secret authenticates the operator's one call out, and each opens only its own door. Like a receiver bearer token it is shown once and stored only as a hash; it lives in a Kubernetes Secret you create (heartbeat.auth.secretName) and reaches the collector as an environment variable. It authorizes nothing but this one request: it is not an agent credential, opens no admin API, and a leaked one lets someone make an operator look alive until it is rotated. The server certificate is verified against the image's trust roots, or against a CA you supply in a Secret (heartbeat.tls.caSecretName); verification is never turned off, and a plain-http:// URL is refused unless heartbeat.allowPlainHTTP is set for a throwaway test.
Turning it on. Creating an operator can enable it in the same step (the create request's heartbeat field, which the UI sends by default and which is false when absent, so a client that predates it never opts anyone in); the install command then carries the --set heartbeat... flags and a kubectl create secret line for the heartbeat secret. For an existing operator, an admin calls POST /api/v1/orgs/{org}/operators/{id}/heartbeat, which mints (or rotates) the secret and returns the one-time kubectl and helm upgrade --reuse-values commands. Rotating makes the old secret stop working at once — the operator's collector then logs a 401 for every attempt until its Secret is replaced and it is restarted. Enabling and rotating are audited (operator-heartbeat-enabled, operator-heartbeat-rotated, with no secret in the entry); individual heartbeats are not. If networkPolicy.egress is on, the heartbeat's address must be added to allowedEgress too.
Where it lands. POST /api/v1/operator-heartbeat on the server's admin listener, authenticated only by Authorization: Bearer <heartbeat secret>: no session, no CORS, no organisation in the path. Success is 200 with an empty body, which is what the collector's exporter treats as delivered. Every failure — malformed, unknown, replaced by a rotation, revoked operator — is the same 401, so nothing reveals which operators exist; repeated failures from one address are throttled, and a revoked operator's heartbeat is rejected. The database write is coalesced to at most one per 15 seconds per operator.
What the UI reads. Each operator in the admin API carries health: {state, lastSeenAt?, reporting}, computed when it is read, never stored. state is unknown when there is no heartbeat credential or none has ever arrived, online when the last heartbeat is within three intervals (180 seconds), and offline after that — and for a revoked operator that had been seen, since it can no longer report. reporting is true once a heartbeat credential exists and at least one heartbeat has arrived.
A new operator is "Setting up", not "Unknown". Until something has been heard from it, a component on the Pipeline page is in a state of its own, Setting up: a pulsing chip, and the steps it is waiting on (created, reports in, first data) under it. It applies to a regional operator whose heartbeat is on and has not arrived yet, to a regional operator with no health reporting that nothing has sent data to yet, and to a local operator whose telemetry was asked for and has not been reported running. It never makes a hop on the strip amber (the tile counts it beside its health chip: "1 setting up") and is never listed under What needs attention. It lasts for the first hour. After that a heartbeat operator that has still not reported, or a local operator that is still not running, becomes Needs attention with the command to run; an operator without health reporting goes back to Unknown, because with no heartbeat there is nothing to be silent about. The central operator is never set up this way: it exists from the start and is as healthy as FUSION.
Local operators that skip the regional hop. A telemetry request whose destination is the central operator does not pass through any regional operator. When at least one does, the strip draws a second route: an arc from the Local tile over the Regional one into the Central tile, counted and coloured for those senders alone (the worst state among them, and their newest data), so a failing direct sender shows on its own line and not on the regional one. The line from Local to Regional then speaks only for the local operators that really go there. Clicking the arc lists the direct senders in the table. With none, there is no arc.
FUSION: where a regional operator saves what it receives
A regional operator normally re-exports to one OTLP endpoint you already run. FUSION is the other choice: a ready-made place to save it, part of the server itself, with one store per signal type, each on its own volume and behind its own Service, a central operator in front as the one door in, and Grafana already connected to the stores:
| Part | What it is | Reached at (inside the cluster) |
|---|---|---|
| central operator | An OpenTelemetry Collector that requires a client certificate and sends each signal to its store | <name>-central.<namespace>.svc:4317 (gRPC) and :4318 (HTTP) |
| metrics | Prometheus, through its native OTLP receiver | <name>-prometheus.<namespace>.svc:9090/api/v1/otlp, OTLP/HTTP |
| logs | Loki, through its native OTLP endpoint | <name>-loki.<namespace>.svc:3100/otlp, OTLP/HTTP |
| traces | Tempo | <name>-tempo.<namespace>.svc:4317, OTLP/gRPC |
| dashboards | Grafana, optional (grafana.enabled), with the three stores as read-only data sources | <name>-grafana.<namespace>.svc:3000; opened through the server, see Grafana and the web pages |
<name> is the server's Helm release name with -fusion added unless it already contains it (release continuum gives continuum-fusion-prometheus). The rule lives in the FUSION chart's fusion.name helper, is mirrored in the server's chart (the Role below names objects by it) and in the server (fusionName), and a test renders the server chart with FUSION inside and checks the Role covers exactly the workloads the chart makes, so none of them can drift without a test failing.
Bundled, and off until you turn it on. The server's chart carries the continuum-fusion chart as a dependency (fusion.enabled, on by default). Its workloads (the central operator, the three stores and Grafana) exist but stand at zero replicas, so a server that never uses FUSION runs nothing extra. On the FUSION page (sidebar, Telemetry), Settings has one switch: Turn on FUSION starts the pods, Turn off stops them after a confirmation. Open Grafana and Open Prometheus are at the top of the page once those are up. The volumes are kept, so turning it back on brings the data back. Choosing FUSION as a destination while it is off, in the telemetry wizard or the New operator form, offers Enable and use, which turns it on and picks it.
What the server may do to make that work. Nothing is installed or rendered by the server: switching is scaling named workloads (the central operator, the three stores and, if present, Grafana) between 0 and 1, plus putting certificates into one named Secret. The server chart therefore adds a namespaced Role (fusionControl.enabled, on by default) that can get and patch the scale subresource of exactly the four StatefulSets (three stores and Grafana) and one Deployment, get those five, and patch (never read) the central operator's receiver Secret. No create, delete, list, watch or exec, no other object, no cluster-wide rule. Only with that Role does the server pod get an API token at all. Set fusionControl.enabled=false and the Role and the token disappear; the screen then says the server cannot switch FUSION and you scale it yourself. A helm upgrade leaves the last decision alone (the chart reads the live replica count back), except under helm template-style GitOps, where there is nothing to read: set fusion.switch.initialReplicas=1 there.
The central operator. Enabling FUSION creates a regional operator owned by the server (op-central, "Central (FUSION)") with its own certificate authority, like any other operator, and fills in its receiver's certificate Secret. It is listed in the Pipeline table with the other operators, marked Managed by FUSION, and cannot be revoked, deleted or edited by hand. Turning FUSION off keeps it: its CA is what every sender trusts. It is the only part that may be exposed to other clusters; the three stores never are.
Sending to it. A regional operator whose destination is the central operator gets an install command with export.otlp.endpoint at the central operator and the chart's export-side mTLS (export.otlp.tls.mtls) on, plus one kubectl create secret with a client certificate issued from the central operator's CA when the operator is created. Nothing in the command mentions Prometheus, Loki or Tempo. Operators in the same cluster reach the central operator by its Service name; operators in other clusters need the central operator exposed (fusion.central.service.type for a LoadBalancer or NodePort, or your own Ingress) and its address recorded under Reachable at on its row. Until then the screen says so, instead of printing a command that cannot work.
Its certificate, and why the address can change. The gateway's certificate lists its in-cluster names and the same stable name every operator has (op-central.continuum-system.svc). Operators that send to it over its public address verify it by that stable name, so recording or changing its address (or the IP behind a load balancer) never invalidates anything. The server reissues it when its names change or it is near its end (checked after every start and then daily while FUSION is on), and the gateway reloads its certificate files every five minutes, so nobody has to remember to renew it. An exposed gateway publishes only port 4317 (central.service.loadBalancerSourceRanges and central.service.annotations keep it private). The client certificates that operators present are renewed by their holders; see Running regional operators.
What the central operator does with what it receives. Each exporter has a sending queue (central.queue.size, 64 requests by default, which with the 3 MiB request cut below bounds a queue at 192 MiB) that retries for central.queue.retryMaxElapsedTime while a store is down. A full queue blocks instead of dropping (block_on_overflow): the receiver then refuses, and the sending operators' own queues hold the data, so a Prometheus, Loki or Tempo restart does not lose a minute silently. The central operator also pushes its own collector metrics (otelcol_*, from service.telemetry) to Prometheus, which the Delivery health dashboard shows as a gateway health row; the stores' own /metrics endpoints are not read. Requests are cut to central.queue.maxRequestBytes (3 MiB) before they are sent, below the 4 MiB Loki and Tempo accept. Where data came from (continuum.org.id, continuum.cluster.id, continuum.operator.id) is read from the resource only: a continuum.* attribute a sender puts on a data point, log record or span is dropped here, so it cannot sit next to the real one as a second, conflicting value. This does not authenticate the resource level: any sender holding a certificate this operator trusts can still claim any cluster there, and telling operators apart for that needs a credential per operator, which is not built.
Who can write and read. Writing requires a client certificate from the central operator. Reading goes through the server's shared API: read-only access tokens, limited to the signals, namespaces and clusters you give them, or an administrator signed in. The stores themselves do not authenticate. They are ClusterIP only, and a NetworkPolicy (networkPolicy.enabled, on by default) admits only the same release, the Ikhnos server and regional operators; see Grafana and the web pages for what that changes on upgrade. The server chart's own networkPolicy.egress lets the server pod reach exactly their query ports and Grafana's. The two web pages (Prometheus, Grafana) are reached only through the server, for administrators.
Routes. The operator chart's export.routes.<metrics|logs|traces> give each signal type its own destination, protocol and credential, next to the default export.otlp, and the export side can present a client certificate (...tls.mtls). The central operator's own collector config does the same fan-out, with one exporter per store: OTLP/HTTP for Prometheus and Loki (the collector appends /v1/metrics and /v1/logs), gRPC for Tempo.
What it is not. Be clear about these before relying on it:
- One FUSION per server, owned by one organisation. Everything saved is shared by whoever sends to the central operator, so only the server's main organisation can turn FUSION on or off.
- The stores do not authenticate. All three are
ClusterIPonly and never exposed by this chart. The central operator is the gate for writing; the server's shared API is the gate for reading. - Retention is per store and local to its volume. Defaults are 15 days for metrics, 7 for logs, 72 hours for traces; Loki's must be whole days.
- It needs the charts published. The server chart is packaged with
helm package --dependency-update, which pulls the FUSION chart in; CI andscripts/publish.shdo that. The FUSION chart is still published on its own (oci://<registry>/continuum-fusion) for anyone who wants to run it without this server.
Reading it back. One token-protected API in the server returns each signal on its own, or a fused object: a trace with its spans, each span with the logs written under its id, and each resource with the metrics saved for it. The join keys are the ones preserved on the way in: Loki keeps trace_id and span_id as structured metadata, so logs attach to a span exactly; Prometheus keeps service.name, namespace, pod, node and the continuum.* identity as series labels, so metrics are found by those resource attributes over the trace's time window. A metric sample does not carry a trace id, so metrics are associated with a span's service and pod, not proven to be caused by it, and the API says so. See Reading FUSION.
What's not automatic, and why
Creating a regional operator hands back a helm install command and companion kubectl create secret lines for the receiver's TLS certificate (and, for a bearer operator only, its token) — nothing is applied on anyone's behalf, following the same declarative-only commitment Telemetry intent's four commitments already states for a single cluster. Alongside those, the server prints one more informational line per source cluster: the exact helm upgrade --reuse-values a person would run against that cluster's own continuum-agent release to actually point its telemetry.export.otlp.endpoint at this operator. That line is a reminder, never executed — there is no live reparenting, no auto-discovery of new children, and nothing pushed to any cluster the moment a regional operator's scope changes. Each of those helm upgrade commands is a separate, deliberate step a person runs themselves, on their own schedule.
Where this doesn't reach yet
Two things worth naming here on purpose, the same way Telemetry intent's own gap section does, rather than letting them quietly disappear into a values file comment:
- Chaining is one hop, and only to a receiver that requires a client certificate. A regional operator can send to another operator (the central one above is the case that is built end to end); a longer chain is not walked or re-validated.
- No fused API yet. FUSION saves each signal in its own store; the token-protected API that returns them separately or fused is the next step — see FUSION.
- No dynamic or automatic assignment. Nothing decides which regional operator a cluster's traffic should feed, and nothing moves that assignment once it's made — a person names the source clusters by hand, once, and changes them by hand later. This is exactly where a future decision-making or reinforcement-learning layer would plug in, once one exists: reassigning a cluster's export target based on load, latency or cost is a real capability this mechanism makes possible, not one it provides today.
Neither gap is urgent, and neither is an oversight — both are the same kind of "decide this on purpose later" the rest of this project's telemetry documentation is honest about elsewhere.
For how a regional operator's own trust boundary (absence of a credential, not absence of a network path) fits alongside agent enrollment and the quick-start gateway token, see Trust model.