Telemetry intent
Where Observability intent is about how far an agent is allowed to see into a cluster, telemetry intent is a related but separate question: given a signal an agent is already allowed to see, should raw OTel data about it leave the cluster at all, and to where. The two systems share a chart, a philosophy of narrowing rather than widening, and a UI (telemetry sits in the same wizard as access tier and namespace scope), but they don't share a trust model — and that difference, not just a list of toggles, is what this page is actually about.
Four commitments
Telemetry's philosophy was never written down as a single statement before this page — it existed only as comments scattered across values.yaml and _helpers.tpl. Reconstructed, it reads as four commitments, and everything else in this chart follows from them:
- Named consent, not raw configuration. Every signal is a labeled, human-readable choice — "Energy", "Accelerators (GPU)" — with a stated permission cost, not a bare OTel receiver name typed into a form. Same instinct as the discovery agent's own collector checkboxes.
- Safe by default, not safe by assumption.
memory_limiterruns first in every pipeline unconditionally — not a toggle, baseline collector hygiene — andredactiondefaults on. The two controls that matter most are not opt-in. - Declarative only. Nothing about telemetry is pushed live. Every change, at install time or afterward, is a generated
helm install/helm upgrade --reuse-valuescommand the cluster owner runs themselves. There is no hidden control-plane channel for telemetry configuration to leak through, even in principle. - Additive permissions. The telemetry
ClusterRolenever depends on or widensaccess.tier; each signal grants only the one read-only rule it specifically needs, and nothing is granted speculatively.
Four axes: scope, layer, modality, kind
Every signal in the UI — "Energy", "Accelerators (GPU)", "Application logs" — is really a point along four axes, and only one of them is a free choice:
- Kind is the only axis a person actually picks: which of the eleven named signals to turn on. Everything below is metadata about a kind, not a further choice within it.
- Modality (
metrics|logs|traces) is a physical fact about a kind's receiver, not a toggle. Ahostmetricsreceiver produces metrics and nothing else; there's no configuration that would make it emit logs. The UI and the catalog (TELEMETRY_SIGNALS) surface it as read-only metadata precisely so it's never implied to be independently configurable. - Layer (
infrastructure|application) is the RBAC/deployment-shape classification each signal has always had — the field this page used to calldomain. It answers "is this about the cluster's own machinery, or about what's running on it," and it's what the permissions section above and the chart'sClusterRolegating are actually keyed on. One signal, accelerators, needs an explicit escape hatch from this: see below. - Scope (
cluster|node|application) is where the real per-kind mechanism lives:- cluster-scoped signals (
kubernetesState,kubernetesEvents,networkLatency) come from a single, cluster-wide receiver — there's no "which cluster" to narrow, so the UI says so rather than pretending a control exists. - node-scoped signals (
resourceUsage,nodeRuntime,systemLogs,energy,accelerators) run one pod per node — narrowing which nodes is the DaemonSet's ownnodeSelector/tolerationsfields (see What one release actually deploys), not a new form control, since a structured Kubernetes scheduling object doesn't fit this form's--set-command model any more cleanly thanscope.selectordoes for namespace scope. - application-scoped signals (
applicationMetrics,applicationLogs,traces) carry real namespace identity and can be narrowed per kind, falling back field-by-field to the install's own globaltelemetry.scopewhen a kind's own override is left empty — the "Application scope overrides" panel in the wizard.
- cluster-scoped signals (
Narrowing by workload, and what infrastructure signals follow. A scope can name workloads inside a namespace (telemetry.scope.workloads, and the same field on each application signal's own override): [{namespace: checkout, names: [cart, payment-api]}] keeps only those workloads' records from checkout, matched on the deployment, statefulset, daemonset, job or cronjob name that k8sattributes puts on each record (the extra names are only extracted when something filters on them). A namespace listed with no names keeps nothing of it; one that is not listed stays whole; a record in a narrowed namespace that carries none of those names, such as a bare pod, is dropped. It is a list, not a map, so a helm upgrade --reuse-values replaces it rather than merging into an earlier command's. Infrastructure signals can follow a scope too, through their own field, telemetry.scope.infra (namespaces, exclude, workloads), which the wizard fills with the combined scope of the application signals when "Apply this scope to infrastructure signals too" is ticked: a namespace is kept if any application signal keeps it and dropped only if every one drops it, and one application signal with no narrowing at all makes the combined scope the whole cluster. Only records that carry a namespace are narrowed, and a record with none is never dropped: the pod and container parts of resource usage and node runtime, the pod and deployment parts of cluster state, and Kubernetes events (by namespace only, since an event has no workload; the namespace is read from the record, or from the event object itself). Nodes, the host's own CPU and memory, energy, accelerators (which keep their own applyScope switch), network latency and system logs are not narrowed, and the wizard says so signal by signal. The continuum.scope tag writes a workload-narrowed namespace as checkout: cart+payment-api.
Accelerators is the one honest exception to "layer settles everything": it's layer: infrastructure for deployment shape (a DaemonSet, no RBAC, reads hardware directly) and scope: node for the same reason, but its GPU metrics can carry the namespace/pod using the GPU via the kubelet's pod-resources mapping — namespaceScopable: true names that explicitly rather than overloading layer with a second meaning. It's opt-in and off by default (telemetry.accelerators.metrics.applyScope): turning it on asks dcgm-exporter for its own Kubernetes pod-label enrichment and lets the install's namespace scope reach GPU metrics the same way it reaches application data, closing the gap the old version of this page's "Where this doesn't reach yet" section named. GPU and accelerator telemetry below covers what actually runs on the node to make that true.
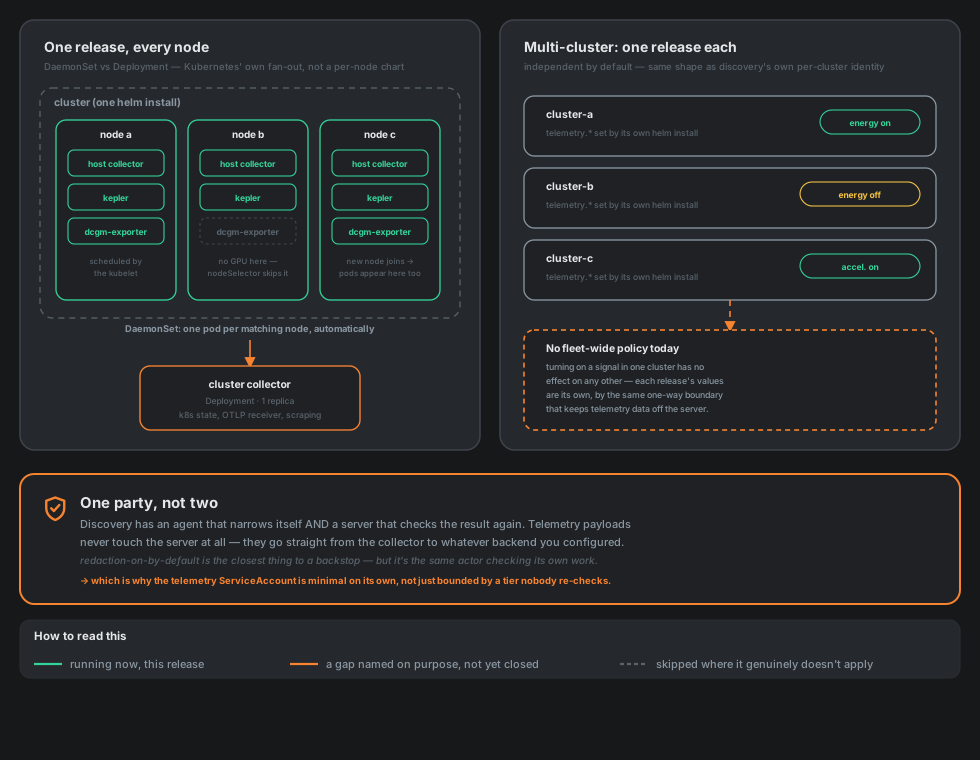
One party, not two
observability-intent.md works because there are two independent parties in the loop: the agent applies scope to itself, and the server checks the result a second time, from outside, before storing anything. Telemetry only ever has one party. By design, the Ikhnos server never sees telemetry payloads at all — they go straight from the collector to whatever backend the operator configured in telemetry.export.otlp. There is no second, independently-trusted actor positioned to re-check what the collector did.
redaction-on-by-default is the closest thing telemetry has to that server-side backstop, but it's the same actor checking its own work, not a second one. That's a legitimate design choice — the point of telemetry is to avoid Ikhnos slowly becoming an observability backend itself — but it means the bar for "safe by default" is higher here than it is for discovery, precisely because nobody is double-checking behind it. It's also why the permissions section below matters more for telemetry than the numbers alone would suggest: the cluster collector's receiver is the one workload in this chart genuinely reachable from anywhere else in the cluster, so its identity has to be minimal on its own, not just bounded by a tier nobody is re-checking.
One thing above is narrower than it reads at first: "one party" is a claim about the payload — nobody re-checks what a collector actually emitted, and that is still true. It is not a claim that the grant authorizing a collector to run is untracked. The TelemetryIntent entity below is exactly that grant, made real and server-side for the local operator the same way store.Operator already made it real for a regional one; Where a grant exports to and Shared CA, not shared enrollment cover what that grant can point at and what bar it has to clear. None of it closes the payload gap this section describes — a TelemetryIntent records what was authorized, never what the collector actually sent — but it does mean local telemetry is no longer a value in a values.yaml file nobody server-side remembers setting.
The TelemetryIntent entity
store.TelemetryIntent is what a local operator — the OTel-Collector telemetry extractors continuum-agent already bundles, the host DaemonSet and cluster Deployment What one release actually deploys describes — is granted to collect and where to send it: the same server-side professionalism store.Operator already gives a standalone regional-operator chart, scoped to one agent instead of a fleet of source clusters. It carries a Namespaces/Exclude scope (the same positive-scope-then-narrow shape Consent.Excluded already uses for an agent's own excluded namespaces — Namespaces empty means "every namespace the agent's own tier/consent already allows," narrowed further by Exclude), a list of Signals (SignalGrant{ID, Source}: ID matches the frontend's TELEMETRY_SIGNALS vocabulary but is opaque to this package, never validated against that list; Source records whether the grant is builtin, existing, or bundle-<tool>), and a Destination — covered in full below.
It runs the opposite direction from Operator, not a renamed copy of it. An Operator fans data in: SourceClusterIDs names many approved clusters feeding one standalone collector, and its own AcceptedModalities narrows what it is willing to take from them. A TelemetryIntent is a grant to one agent (AgentID, not a list) telling its own already-running local operator what to collect and where to send it. Core.CreateTelemetryIntent only accepts a target that is currently StatusApproved (approvedAgentInOrg) — the same "real and currently approved" check validSourceClusters makes per source cluster, here made per single agent. Like Operator, a TelemetryIntent has no "pending" state: TelemetryIntentActive/TelemetryIntentRevoked is the whole lifecycle, and creating one takes effect the moment it is stored, because — see Shared CA, not shared enrollment — there is nothing external here to wait on the way agent enrollment has.
At most one active intent may exist per agent: a second CreateTelemetryIntent call against an agent that already has one fails with KindConflict naming the existing intent, rather than layering a second grant on top of the first. This is a stated scope boundary for this release, not an oversight that slipped through — the chart renders one default telemetry.export.otlp destination per install, and a second, concurrently active intent would need one of its own. Sending each signal type somewhere different from the same agent exists now (see "One destination per signal type" below) and is a property of the install, not of a second intent. UpdateTelemetryIntentScope and UpdateTelemetryIntentDestination — both re-validating everything they touch, exactly as creation does — are the only way forward once an intent exists; nothing here does live reparenting, the same limit UpdateOperatorScope already states for a regional operator.
Where a grant exports to
A TelemetryIntent's Destination is the exact same store.Destination struct a regional Operator already uses, not a parallel shape built for this entity. Kind is external or operator. external is unchanged from how telemetry export has always worked: a raw OTLP Endpoint, optionally with its own CA file and auth header/secret, rendered into telemetry.export.otlp.* the same way the wizard's own withTelemetry() always has. operator is the new piece: TargetOperatorID names a regional operator in this same organisation, and Core.validateDestination — now a Core method specifically so it can check this, rather than the free function it used to be — confirms that operator exists, belongs to this org (operatorInOrg's own not-found-not-forbidden convention for a foreign org's operator), and is currently OperatorActive. Before this, a destination naming another operator was rejected unconditionally, everywhere it could be submitted; validateDestination now accepts it from both Operator.Destination and TelemetryIntent.Destination alike, the only two places it is called from. For an operator destination, Address (a host:port, optional) is the address this sender dials to reach that operator, chosen on the sending side; unset, the command dials the operator's recorded address. It is validated and normalised like a recorded address, is allowed only on an operator destination, and is kept per route, so each signal type can dial its own. Only the endpoint changes: the certificate is still verified by the operator's stable name.
This makes Ikhnos's fleet two tiers, deliberately not a deeper one: an agent's own intent, or an operator's own destination, may point directly at one regional operator, but that target operator's own Destination — if it is itself "operator" — is never walked or re-validated here. validateDestination's own comment says so plainly: operator-to-operator chaining beyond one hop is not something this release builds.
An operator can separately narrow which modalities it is willing to take from whatever points at it — Operator.AcceptedModalities: metrics/logs/traces, empty meaning "accepts everything," the only behaviour possible before the field existed (which is why telemetry_migrate.go's schema bump to version 8 defaults every pre-existing row to [] rather than silently changing what it already did). This is now enforced on the grant side: Core.checkOperatorAcceptsSignals (backend/internal/server/telemetry_intents.go) runs right after validateDestination succeeds in CreateTelemetryIntent, UpdateTelemetryIntentScope and UpdateTelemetryIntentDestination alike, and compares a TelemetryIntent's Signals against its destination operator's AcceptedModalities whenever that destination is "operator" and the allowlist is non-empty. The comparison goes through a small static signalModality lookup mirroring the frontend's TELEMETRY_SIGNALS table, keyed by SignalGrant.ID; an id that table does not recognise (a newer frontend's not-yet-known signal) is deliberately let through unchecked rather than treated as a mismatch, so this backend never fails closed on a signal shape it cannot yet vouch for. A recognised, incompatible signal fails with KindInvalid, naming the signal and the modality it does not fit — UpdateTelemetryIntentScope re-checks new signals against the intent's current destination, and UpdateTelemetryIntentDestination re-checks the intent's current signals against the new destination, so a mismatch introduced from either side of the pair is caught. The regional-operator chart's own receiver config still never references AcceptedModalities itself — this closes the grant-time gap, not a runtime one at the collector.
The certificate problem an operator-destination grant runs into is narrower, and is solved. CreateOperator mints each source cluster its own mTLS client certificate at creation time and — like every secret in this app — never stores it; a TelemetryIntent created afterward, pointing at that same operator, had no way to get one. Core.IssueOperatorClientCertFor mints a fresh one on demand, for the one sender that will hold it, for exactly this case, and is safe to call as many times as there are grants against that operator: its receiver trusts the operator's own CA (the org CA only for an older operator without one) through client_ca_file (backend/internal/chart/continuum-regional-operator/templates/config.yaml), not one pinned certificate, so every certificate IssueOperatorClientCertFor or CreateOperator ever mints for it validates identically. The certificate's identity is the holder's: CommonName: operatorID + "-export-" + sender, where the sender is the granting agent's cluster (or the exporting operator), so each cluster has a credential of its own and the server's ledger (store.OperatorCert, listed at GET /operators/{id}/certificates) records who holds which and until when. The receiver does not yet check that name: it accepts any certificate its CA signed, and the stock collector does not expose the certificate's subject to its pipeline, so the identity is a record, not an enforced boundary. For an operator created today that certificate is the receiver's only gate (receiverAuth: "mtls" in the /command response means the person supplies no bearer token at all); for an older, bearer operator the flags are unchanged and the person still supplies its token themselves. /telemetry-intents/{id}/command is where this actually gets used: for an operator destination, it calls IssueOperatorClientCertFor and folds the result — via the same operatorDestinationCommand helper operatorSourceReminders already uses for a brand-new operator's own source clusters — into the resolved --set telemetry.export.otlp.* flags and a kubectl create secret command for the one agent the intent targets.
One destination per signal type
By default every signal goes to the one telemetry.export.otlp destination. That cannot serve a backend that only takes one type (Zipkin and Jaeger take traces, Loki logs, Prometheus metrics), so each of metrics, logs and traces can also have a route of its own: telemetry.export.routes.<metrics|logs|traces>, the same shape as otlp (endpoint, protocol, TLS, a credential Secret, and an mTLS Secret for a regional operator). otlp stays the default, and a route only overrides it for its own signal type, so an install without routes renders byte-for-byte as before.
The chart renders one exporter per destination in use and each pipeline names only its own. The collector split is respected: the host DaemonSet carries metrics (resource usage, node runtime) and logs (system logs), the cluster Deployment everything else including traces, and a route's credential or certificate Secret is mounted only into the collector that uses it. Zipkin is accepted as a route only for traces. An enabled signal with neither a route nor a default endpoint fails the render, naming both ways to fix it.
The wizard offers it as the first choice on the Where to send step: one destination for everything, or one per signal type (only when two or more types are on). Each type that has a signal on gets a card holding the same destination picker, filtered to what can carry that type, with its own protocol, TLS and credential. Switching to split starts every lane from the single destination where that can carry it, and switching back keeps the lanes. A lane can reuse another lane's credential Secret with one click, and lanes naming the same Secret share one kubectl create secret command and one environment variable.
Every route is stated on every command, in full when in use (protocol, TLS and credential too) and as an empty endpoint when not, because helm upgrade --reuse-values keeps anything unmentioned. A single-destination command states the routes empty only when the install is known to have some (the agent reports its destination as traces=zipkin:9411,default=gw:4317 when routed, and the change-telemetry panel is seeded from that). The one exception is a route the install already has that nothing in the wizard has edited: the agent reports where it goes but not how it is spoken to (protocol, TLS, credential), so the command leaves it out and --reuse-values keeps it as installed. Stating it would reset those to defaults and quietly break a route that differs. Editing it in the wizard (the draft marks it "kept as installed" until then) makes it the draft's to state, in full.
A regional operator can be the destination of a signal type like any other. The server then has to be involved, because its receiver is mutual TLS and only the server can issue a client certificate, so the TelemetryIntent records the routes: Routes maps each signal type to a Destination (an operator, or an external endpoint by the names of its credential Secret, never a value), and Destination stays the default, which is only the first lane once every lane has a route. Every granted signal is checked against where it goes (checkDestinationsAcceptSignals): its route when it has one, the default otherwise, so a metrics-only operator is a valid home for the metrics route of an intent that also grants logs. POST .../telemetry-intents/{id}/command issues one client certificate per operator however many routes name it, returns one kubectl create secret for it, and states each operator route in full (endpoint, gRPC, verified TLS, tls.mtls.enabled, the Secret name <operator>-export-mtls). It also returns each operator's receiver auth (operators), since two lanes can go to operators that authenticate differently. A route to a bearer operator keeps its token Secret, named in the lane like any other credential. Schema version 13 adds the routes column; an intent from before it has none and sends everything to its one destination.
Shared CA, not shared enrollment
Local telemetry and the discovery agent now share two pieces of infrastructure, and it matters which two: it would be easy to assume local telemetry simply inherited the discovery agent's whole trust model, and it did not.
What is shared is the CA machinery. pki.CA is one type, and IssueAgent (an agent's own enrollment certificate), IssueOperatorReceiverTLS/IssueOperatorClientTLS (a regional operator's receiver and client certificates), and the IssueOperatorClientCert reissue path a TelemetryIntent uses all mint off a CA of that one type — the org CA for an agent's enrollment certificate, and, for an operator created with its own private CA, that operator's CA for its receiver and client certificates (and the reissue path), so one operator's certificates never vouch for another's; an older operator without a CA of its own keeps being minted off the org CA. What is also shared is the audit chain: every TelemetryIntent mutation — created, scope changed, destination changed, revoked, deleted — runs through Core.audited, the identical fail-closed mechanism an agent's own tier and consent changes already use (see Observability intent): the audit row is written first, and if that write fails the action itself never happens, so the trail never has to explain something retroactively that nobody could see happen.
What is deliberately not shared is the discovery agent's own enrollment and approval workflow — an agent generates an approval code locally, prints it only to its own pod log, and an administrator has to go read that code from the cluster's own logs and type it into the approve dialog before the agent is trusted at all (Trust model). That machinery is built around a live process: something that can poll the server, hold a private key across restarts, and prove — by what it chooses to print to a log channel the server cannot write to itself — that a human with real access to the cluster is the one vouching for it. A TelemetryIntent has nothing of the kind to offer, and nothing of the kind to prove: it targets a workload that already cleared that exact bar once (Core.approvedAgentInOrg requires the target agent to already be StatusApproved), and what it grants on top is not a new identity to trust but a narrower scope for a collector the agent's own chart already bundles — no different in kind from the tier and consent changes Observability intent already covers under the same bar. An OTel-Collector-shaped workload could not clear discovery's own bar even if asked to: it has no log a human is meant to go read, and nothing about its job calls for one.
This is why creating or changing a TelemetryIntent has no pending state the way agent enrollment does, and why its routes are gated to editorRole, not the adminRole a regional operator's own CRUD needs: it is held to the same declarative, immediately-effective bar this app already applies to an agent's own tier and consent, not a weaker one invented for telemetry specifically, and not the heavier one discovery's own enrollment needs because nothing here is a new identity being vouched for. The one step that is held to that heavier bar is /telemetry-intents/{id}/command: resolving a grant into a command mints real credential material (a fresh client certificate, via IssueOperatorClientCert) when the destination is an operator, so it takes adminRole — the same reason regional-operator CRUD itself needs adminRole rather than editorRole. That one step, not the grant itself, is where this model's bar actually rises to meet the kind regional operators and enrollment both already clear.
What one release actually deploys
Kubernetes already has a primitive for "run this on every node," and telemetry uses it rather than reinventing it. The host collector, Kepler and dcgm-exporter are each a DaemonSet — the kubelet schedules one pod per matching node automatically, the moment a node joins or a taint/toleration/nodeSelector changes, with no per-node install step of any kind. The cluster collector is a Deployment with one replica: cluster-wide aggregation — k8s object watching, Prometheus-shaped scraping of Kepler/dcgm, and the OTLP receiver applications push to directly — only ever needs to exist once.
So a single helm install already reaches every node in that cluster. There is no separate chart per node, and nothing to make "node-specific": scope, in the sense of which nodes, is Kubernetes' job, expressed through the DaemonSet's own tolerations/nodeSelector fields (already used, for instance, to keep Kepler off nodes without an arm64 image), not something this chart has to re-solve. This is the mechanism behind the node value of the scope axis described in Four axes below — it already existed, independently, on every DaemonSet-backed signal; that section just gives it one name.
Multi-cluster starts the same way it always has: one release per cluster, independently. The discovery agent already works this way — one enrolled identity per cluster — and telemetry, sharing that chart, inherits the same shape. Each cluster's telemetry.* values are its own, and turning on a signal in one cluster still has no effect on any other's configuration.
What's changed is that those independent exports no longer have to stay siloed once they leave a cluster. Regional operators are a second, explicit fan-in tier above the per-cluster one this page describes: a standalone collector that receives what a set of already-approved clusters already export and re-exports it as one stream. Be precise about what that does and doesn't solve — it's fan-in aggregation of exports that are already flowing, not a fleet-wide telemetry policy. Turning a signal on across many clusters at once, in a single action, is still genuinely absent: each cluster's telemetry.* values still have to be set by that cluster's own helm upgrade, one at a time. A regional operator changes where already-collected data converges, not how many clusters' collection settings a single action can change. Whether the Ikhnos server ever becomes a place that reasons about telemetry configuration across a fleet — as opposed to relaying its already-collected output — is still the same open question Recommendation 7 of the design review names for the one-way data boundary.
The pipeline itself
Every pipeline — host metrics, host logs, cluster metrics/infra, metrics/app, logs/infra, logs/app, traces — runs processors in the same fixed order: memory_limiter first, always; k8sattributes for identity, where the receiver needs it; resourcedetection if enabled; redaction if enabled (on by default); whatever the pipeline itself specifically needs (a node-identity transform for infra metrics, the namespace scope filter for application-domain pipelines, probabilistic_sampler for traces below 100%); the extraProcessorNames escape hatch (and, traces only, extraTracesProcessorNames as well); resource/tags when the person added tags; resource/continuum, always second-to-last; batch, always last. memory_limiter has to be first to protect the collector before anything else touches the data; batch has to be last so it never batches data a later processor might still drop.
memory_limiter is paired with a computed GOMEMLIMIT environment variable on each collector container — set from that container's own resources.limits.memory, so Go's garbage collector backs off in step with the processor instead of the two fighting each other under memory pressure — rather than left to coincidence, which is where most charts that add memory_limiter stop.
resource/continuum is the one processor in that order that is never a user on/off toggle and is not meant to be hand-edited in values.yaml: it stamps continuum.org.id, continuum.cluster.id and continuum.intent.id as plain resource attributes (action: upsert) onto every signal this agent emits, regardless of destination — filled in by the server's own generated helm upgrade command (telemetry.resource.*), the same way access.tier and server.caPin are server-composed rather than user-edited. Placing it after extraProcessorNames (and, for traces, extraTracesProcessorNames) and right before batch is the whole guarantee: action: upsert plus running last beats whatever an earlier, user-supplied processor in that same escape hatch tried to set on these same three keys first. This is what lets a signal be traced back to the TelemetryIntent that authorized it even once it has crossed into a regional operator's own re-exported stream, and it holds in every pipeline, not just the common case — telemetry-host-config.yaml and telemetry-cluster-config.yaml both build their processor list the same way, appending resource/continuum after every escape hatch and immediately before batch, with no exceptions.
Alongside it, telemetry.resource.scope adds continuum.scope (for example shop; payments - excluding legacy+tmp) whenever the telemetry is narrowed to some namespaces, so a backend can tell narrowed data from whole-cluster data; the intent id and the scope are only stamped when there is one to say. Org and cluster are stamped for every destination, not only a regional operator: the wizard's command carries them for an external backend too.
Which extractor produced a record: continuum.source. Every pipeline of both collectors also ends with a small transform/continuum_source_* processor, placed after the person's own extraProcessors and just before the tags, provenance and batch, which sets continuum.source on the resource (plain set, so a processor of their own cannot make a record claim another source). The value names the receiver or scrape job that produced the record. Host collector, metrics: hostmetrics (the node's CPU, memory, disk and network) or kubeletstats (pods, containers, volumes and the node as the kubelet reports them); host collector, logs: container-logs or journald. Cluster collector, infrastructure metrics: k8s-cluster (cluster state), cluster-links (the agent's passive link counters), link-prober (the active probe), kepler, energy-existing, dcgm-exporter or accelerators-existing; application metrics: prometheus-scrape (the scrape targets the person listed), network-latency (the agent's own path measurements) or otlp (whatever an application pushes); logs: k8s-events or otlp; traces: otlp. FUSION promotes it to a label (continuum_source), so a panel or an alert can say "only what the link prober measured" and a series from the wrong extractor stands out. It describes how the record was produced, not who the application is: that stays service.name.
A regional operator the telemetry is sent through adds a fourth layer of the same kind on its own side — continuum.operator.id, continuum.operator.name and its labels, stamped by resource/operator with the same upsert-last rule (see Regional operators).
Tags (telemetry.resource.attributes, at most 10, at most 8 of them added by hand in the wizard) put a name and value on everything the release emits. They sit in resource/tags just before provenance and use action: insert, never upsert: a name an application already set on its own telemetry keeps the application's value, so a tag can add context but cannot rewrite what a service says about itself. The continuum. prefix is refused by the chart (and by the wizard), because those names are provenance. The field is a list of {key, value} rather than a map on purpose: in a helm upgrade --reuse-values, a map keeps every key an earlier command set, so a tag removed in the wizard would silently survive, while a list replaces the whole set.
Debug exporter (telemetry.debug.verbosity): basic adds a debug exporter beside the real one on every pipeline that logs only how many records passed, which is the quickest way to see that anything flows; the wizard turns it on by default. detailed logs every record's content to the collector's own log, which can include secrets and personal data and, if the collector's logs are themselves collected, feeds back into the telemetry; it is a deliberate, short-lived choice and the wizard warns accordingly. Empty is off, and the chart's own default.
Energy telemetry
Energy asks no question in the wizard: ticking it deploys the bundled Kepler (telemetry.energy.metrics.source=bundle-kepler) as a DaemonSet, scoped read-only like every other node-scoped signal, and the signal's row says so (a privileged pod on every node). The chart still has a second source, existing, which points the cluster collector's scrape config at a Kepler-shaped Prometheus endpoint already running (telemetry.energy.metrics.existing.prometheusEndpoint); the wizard offers that choice, and its endpoint field, only for a configuration that is already loaded with it, so editing such an install changes nothing behind your back. For a new install, add --set telemetry.energy.metrics.source=existing to the printed command by hand. What's worth being precise about — because it was never actually confirmed against this chart's own rendered config before now — is what the bundled DaemonSet measures and what it needs to do it.
Kepler is model-based by design, not a thin RAPL reader with a Prometheus endpoint attached: it uses eBPF to continuously sample per-process hardware performance counters (CPU cycles/instructions) and estimates per-process/per-pod power draw from those counters through a pre-trained power model. RAPL — read, read-only, from the /sys hostPath this DaemonSet already mounts — is the true node-level power reading Kepler uses to calibrate and attribute that per-process estimate when the kernel exposes it; it is not a hard prerequisite for Kepler to produce an energy metric at all. The rendered Kepler container (the DaemonSet in telemetry.yaml) passes no command, args, or env beyond the image/resources/scheduling fields values.yaml already exposes, so nothing in this chart forces RAPL-only operation or overrides Kepler's own upstream fallback — a node with no /sys/class/powercap/intel-rapl interface still gets Kepler's model-estimated numbers, exactly as upstream documents, with no extra flag required. That is a real difference from this project's other energy signal: the discovery agent's own node-probe reads intel-rapl's package-0 counter directly (backend/internal/probe/read.go) and returns a nil host_watts the instant that counter is absent, by design, with no estimator behind it at all. Kepler is the one of the two that still produces a number on hardware RAPL doesn't cover.
It is not, by itself, an edge/ARM answer, and this chart doesn't claim otherwise: telemetry.energy.metrics.nodeSelector defaults to kubernetes.io/arch: amd64 specifically because the upstream Kepler image (quay.io/sustainable_computing_io/kepler, pinned via keplerImage.tag) ships no arm64 build — the DaemonSet is kept off arm64 nodes on purpose (the same exclusion What one release actually deploys above already names), rather than left to crash-loop on ImagePullBackOff there. Getting Kepler onto an arm64 edge node means building or sourcing an arm64-capable image and overriding that selector yourself; this chart does not do it for you, and the values.yaml comment next to the selector says so plainly. Kepler's RAPL-less estimator is a genuine answer for non-RAPL x86_64 hosts — a number of cloud VM shapes and some embedded x86 boards never surface /sys/class/powercap/intel-rapl to a guest at all — not, today, a working path onto Arm.
GPU and accelerator telemetry
Accelerators' node scope and its applyScope escape hatch were introduced structurally in Four axes above; this section is the deployment mechanics behind it — what actually runs on a GPU node when telemetry.accelerators.metrics.enabled is on.
Like energy, accelerators has two sources. bundle-dcgm deploys NVIDIA's own dcgm-exporter as a DaemonSet, one pod per node the selector matches; existing just points the cluster collector's scrape config at a dcgm-exporter you already run. It's the same two-source pattern Kepler offers for energy, for the same reason: some clusters already run a GPU exporter for something else, and bundling a second one there would be redundant, not helpful.
The bundled DaemonSet needs the NVIDIA driver and the NVIDIA Container Toolkit already present on the node — this chart cannot install either, the same hard dependency Kepler has on an arm64 image it doesn't ship. Its security posture is deliberately narrower than Kepler's: NVIDIA's own documented requirement for reading GPU state through DCGM is root plus the SYS_ADMIN capability, not Kepler's full privileged: true, so the container runs runAsUser: 0, drops every other capability, and still refuses privilege escalation. automountServiceAccountToken: false, with no per-container override anywhere in its pod spec: dcgm-exporter reads GPU hardware and the kubelet's own pod-resources socket directly, never the Kubernetes API, so unlike the host and cluster collectors it needs no RBAC rule in telemetry-rbac.yaml at all. One thing this container's security context leaves open on purpose: readOnlyRootFilesystem is not set, unlike every other container in this chart. There is no GPU hardware in this project's own dev/test environment to confirm dcgm-exporter never writes to its own root filesystem, and guessing wrong would crash-loop every DaemonSet pod the first time someone with a real GPU node actually turned this on — so it's named here, honestly, rather than discovered later as someone else's outage, and left open until it's verified against real hardware.
Which nodes actually get a pod is the DaemonSet's own telemetry.accelerators.metrics.nodeSelector/tolerations values — the same node-scope mechanism What one release actually deploys describes for every node-scoped signal, narrowed here to GPU-bearing nodes specifically, rather than scheduling onto every node and failing on the ones without a GPU. The exporter speaks Prometheus, not OTLP: it exposes :9400/metrics, and the cluster collector scrapes it exactly the way it scrapes Kepler, folding GPU utilization, memory, temperature and power into the metrics pipeline instead of standing up a second ingestion path for it.
applyScope's pod-label enrichment is implemented as two environment variables, both only set when the flag is on: DCGM_EXPORTER_KUBERNETES turns on GPU-to-pod mapping at all, and DCGM_EXPORTER_KUBERNETES_ENABLE_POD_LABELS is what actually attaches namespace/pod/container labels to the metrics it emits. Both reuse the same read-only pod-resources hostPath mount the exporter already has for GPU accounting — no second volume, no wider mount, just a different use of a socket that was already there.
Permissions
Telemetry's collectors run under their own ServiceAccount — {{ include "agent.name" . }}-telemetry — separate from the discovery agent's, and by extension from whatever access.tier ClusterRole the agent's own identity holds. automountServiceAccountToken: false at the ServiceAccount level; only the two collector containers that actually call the Kubernetes API (for k8sattributes pod/namespace/node identity) mount it, explicitly, in their own pod spec. If the cluster collector's receiver is ever compromised — the one component in this chart reachable from anywhere else in the cluster — the token an attacker gets reaches exactly what telemetry itself needs, structurally, not the union of that and whatever tier the install happens to be running at.
Each RBAC rule in telemetry-rbac.yaml is gated behind the one signal that actually needs it: k8sattributes needs pods/namespaces/nodes; kubeletstatsreceiver (resource usage, node runtime) needs nodes/stats only, read directly from each node's own kubelet — never proxied through the API server, so it needs no nodes/proxy permission; k8sclusterreceiver (Kubernetes state) needs the same read-only object kinds kube-state-metrics itself watches; k8sobjectsreceiver is scoped to events only, nothing else it could technically be pointed at. Re-render with helm template after changing telemetry.* to see exactly which permission set a given configuration holds — the values file comments cross-reference which RBAC rule each signal requires directly.
Entry points, one wizard
Every place telemetry gets configured — at install time, right after, or much later — opens the same guided wizard (TelemetryWizard), with the agent's self-report, the draft and the generated command behind it. There is no second, flat form of fields next to it. What differs is only how a person arrives:
- the Set up telemetry button on the Pipeline page and on the Agents page, with no target chosen yet;
- the Change telemetry disclosure in an agent's details, which is the same wizard in place, with no modal and no picker, because the target is already the agent it is attached to.
useTelemetryFlow() opens the dialog from the first. With no target resolved, the Where from step lists approved clusters to pick from, and if there are none yet, hands off to the "Connect a cluster" flow rather than bundling discovery into a telemetry modal — connecting a cluster is always a separate, prior step, never something this wizard does on a person's behalf. The steps are:
- Where from — the cluster.
- What to collect — every signal grouped by layer and, inside each, by modality (each group with its own select all / clear and an "n of m" count), with presets ("minimal/cost-aware," "full infrastructure," "full infrastructure plus app tracing," or "debug everything," for a short deep-dive) as starting points rather than locks. Once something application-scoped is checked, a scope-drafting step follows, and the "Application scope overrides" disclosure — per-kind namespace include/exclude lists for application metrics, logs and traces, each falling back to the install's own global
telemetry.scopewhen left empty — is the real control behind the application value of the scope axis in Four axes. Energy's and accelerators' own source pickers (bundle it, or scrape one already running) appear the moment their checkbox is on. The less common parts sit behind a "Tags, masking and sampling" disclosure, collapsed unless something inside it is already non-default: tags, the resource-detection and redaction toggles, the traces sampling percentage, and a processor editor — filter, tail sampling (traces only, routed to the traces-only extra-processor list rather than the shared one, since it's the one of the three that doesn't implement every signal's processor interface), and transform, each compiling to the exact raw processor body the chart's ownextraProcessorNamesescape hatch already accepts, with a raw JSON override available on any entry for anything the three typed kinds can't express. Energy asks for no source: a new configuration deploys the bundled exporter like the other signals, and the picker for an existing Kepler appears only when the configuration being changed already scrapes one. - Where to send — one merged list: FUSION, the operators in this system, backends detected in the cluster, the built-in presets, and another OTLP endpoint. An entry that cannot take a chosen signal — a traces-only preset like Jaeger once a metrics signal with no compatible counterpart is also on, say — stays in the list, can't be picked, and says why. The credential header sits with the destination.
- Review and install — in plain words, what changes, what does not change, and what happens if you stop, and only then the command.
After the command comes Check that data arrives. "Installed now" and the draft are both seeded from the agent's own self-report (installedTelemetry) — covered in full in Reconfiguration below — never from a blank form.
None of this is pushed anywhere by the wizard itself. Every path through it ends the same way every other telemetry change in this chart does: a helm upgrade --reuse-values command, copyable, for the cluster's own owner to run themselves.
Interoperability
Every destination preset — Honeycomb, New Relic, SigNoz, Splunk, Chronosphere, Jaeger, Grafana Cloud, Datadog, Elastic Cloud, self-hosted — resolves to the exact same telemetry.export.otlp.* shape. There is no per-vendor export mode to maintain or drift out of sync; only UI sugar over one generic OTLP exporter. AWS/Azure/GCP are deliberately not offered as one-click presets — those backends need IAM-style auth a generic OTLP exporter can't do — and the UI says so explicitly rather than silently doing nothing.
With Ikhnos itself, telemetry is a one-way configuration channel by design: the server tells the cluster what to collect and where to send it, and never receives, stores, or reasons about the telemetry data itself. One place that boundary is meant to be crossed cleanly rather than blurred: the networkLatency signal is meant to re-emit the discovery agent's own already-existing path-measurement capability as OTel metrics, real reuse across the discovery/telemetry line rather than a parallel implementation of the same idea. Today that's a contract, not yet a fact: the collector side is real and enforced (a reserved service.name of continuum-network-latency, and every application-scope filter — global or per-kind — is built to leave records carrying it untouched, structurally exempt rather than merely un-scoped by omission), but nothing in this codebase's Go agent emits OTLP yet, so no cluster today actually produces that data. See Where this doesn't reach yet.
One more interoperability surface, and entirely separate from the self-report mechanism above: each collector can optionally run an OpAMP client extension (telemetry.opamp.enabled, off by default, ALPHA status upstream), connecting outward over a WebSocket to an external OpAMP server — a fleet-management tool the operator runs, not anything Ikhnos operates or even knows the address of beyond what's in that cluster's own values.yaml. Once on, the extension reports the collector's own effective configuration, health, and available components to that server, on OpAMP's own terms (reports_effective_config, reports_health, reports_available_components — all left at their upstream defaults of true rather than restated, since there's nothing here to override). The chart fails the render outright if the flag is on without a telemetry.opamp.server.endpoint to report to, rather than silently enabling an extension with nowhere to send its reports. It's worth being precise about what this is not: it is a different channel from installedTelemetry/CONTINUUM_TELEMETRY_SIGNALS (see Reconfiguration below), which already tells the Ikhnos server which signals are on, over the agent's own gRPC heartbeat. OpAMP, if an operator turns it on, tells a third-party OpAMP server about the collector itself, over a protocol OTel defines for exactly that purpose. The two self-reports never talk to each other, have no shared state, and turning one on implies nothing about the other.
Quick-start observability backends
:::note No longer offered from the local operator's wizard
The local operator's wizard used to offer "don't have a backend yet?" and "Set up a new destination", which generated an install for a backend. It now only picks where telemetry goes: a regional operator, a built-in preset, a receiver discovery already found in the cluster, or an endpoint you type. A place to save telemetry is a regional operator's job — see FUSION. The specs, commands and gateway described below are kept in the code (quickStartBackends.ts, quickStartGateway.ts, the quick-start panel and its wizard) for reuse, and are not reachable from the telemetry wizard.
:::
Every destination preset above assumes a backend already exists somewhere. For a brand-new install — or a demo, or a cluster nobody's wired a backend up for yet — "Send telemetry to" has a second option right underneath it: "don't have a backend yet?", which can quick-start Jaeger, Zipkin, Prometheus or Loki in the same cluster in minutes, from a generated command, not an automatic deploy. Same mechanism-only shape as every other install command in this app (ConnectClusterWizard, regional operators): a helm install against a well-known upstream chart that a person runs themselves, never something the server dials or deploys on its own.
The three commands behind this were checked against each chart's actual current templates and values, not remembered from an older major version or lifted from documentation alone — verified by running helm template with the exact flags each generated command passes, after an earlier draft was caught pointing Jaeger at a values shape its own latest chart release no longer has. Jaeger's chart moved to the OTel-collector-based "Jaeger v2" engine, so there's no more all-in-one/agent/collector/query split left to flag with a --set; the generated command instead passes a full collector config (a receiver, a batch processor, Badger storage set to the chosen retention, and the health-check extension the chart's own readiness probe requires unconditionally) as one --set-json block. Prometheus's quick-start turns on its native OTLP receiver for the chosen retention window and disables every sidecar chart component it doesn't need for this (Alertmanager, the pushgateway, the node exporter) — the OTLP endpoint is HTTP-only, under /api/v1/otlp, and the Service answers on port 80, not the container's own 9090. Loki's quick-start uses the chart's own useTestSchema/filesystem-storage escape hatch — its default reference values still assume an S3-shaped object store even in single-binary mode — scaled down to exactly one pod (every read/write/backend replica count at zero, the gateway and the canary DaemonSet both off, both caches off), with OTLP logs landing on the standard HTTP port under /otlp. Each spec also carries the resulting exportEndpoint/exportProtocol so "Use as destination" can fill the shared destination field directly, and a kubectl port-forward line for reaching the tool itself with nothing in front of it.
Zipkin is the one kind that is not a chart, and it is not OTLP either: it takes its own span format on port 9411, so the agent exports to it with the collector's own zipkin exporter (telemetry.export.otlp.protocol=zipkin) and its quick-start is a kubectl apply of one Deployment and one Service — Zipkin itself with in-memory storage, nothing in front of it. The destination is the Service's host:port; the chart adds the scheme (http:// when "skip TLS verification" is on, which an in-cluster quick-start has) and Zipkin's /api/v2/spans path, and a full URL, path included, is used exactly as written. Zipkin can only receive traces, so this protocol is refused at render time — and in the wizard, before any command is printed — when any other signal is on; a self-hosted Zipkin is also a catalog entry of its own, and one already running in the cluster is found by its image. Its "retention" is a span count (MEM_MAX_SPANS, digits only — anything else typed there never reaches the manifest), and everything is lost when the pod restarts, which the wizard's existing "sized for trying this out" note says for every kind.
Which of these four kinds — plus a fifth, "custom," for a backend with no catalog entry of its own, just a user-supplied label and URL — an organisation may add at all is a per-organisation allow-list (settings.allowedBackendKinds), managed by an administrator right inside this same panel. Empty falls back to the four built-ins; "custom" is deliberately never on by default, since naming an arbitrary external URL as a telemetry destination is a capability an administrator opts an organisation into, not one every existing organisation should gain silently the next time this ships. Saving a backend validates it server-side against whatever's currently allowed — namespace shape, retention kept as free text and never parsed (what each backend's own retention flag accepts differs by backend), and, for "custom" specifically, a required http(s) tool URL, since there's no catalog entry for "open this tool" to fall back to otherwise.
The access gateway: a token broker, and a gateway that never calls home
A quick-started backend installed with no access control at all is reachable by anything in the cluster that can reach its Service — fine for a five-minute Jaeger in a dev namespace, not something this page should leave unaddressed for a backend that might end up holding real telemetry. The fix is three independent pieces, each named for what it does:
- The install itself. The
helm installabove, plus theQuickStartBackendrecordsettings.quickStartBackendskeeps, so the panel remembers a backend is already set up and offers "Use as destination"/"Open <tool>" instead of the setup form a second time. - A gateway token. Minted server-side, on request, by the admin API: a fresh random secret, hashed before it's stored — the same convention the regional-operator receiver token already follows — returned once in the mint response and never again. Checking on it afterward only ever reports whether one is active and when it expires, never the value itself. Its lifetime is a TTL an admin can ask for, clamped server-side into a five-minute-to-seven-day range rather than rejected outright if it's out of bounds, defaulting to 24 hours — a short-lived credential applied as a Secret the admin controls end-to-end doesn't need the strictness an enrollment token needs.
- The gateway itself. A plain Kubernetes manifest, not an Ikhnos-maintained chart: a one-replica Deployment of a pinned nginx stable-line image (an exact version, not the moving
alpinetag) whose entire configuration, kept in a Secret because it contains the token, is onelocationblock checkingAuthorization: Bearer <token>with a bare nginxif, proxying to the quick-started Service's own port — Jaeger's query port 16686, Prometheus's server port 80, Loki's HTTP API port 3100 — on a match, and returning 401 otherwise. It's generated with the token already templated in, applied with a singlekubectl apply -f -(followed by one line that removes the ConfigMap an earlier version of the manifest created, if it is still there), and only for the three built-in, gated kinds: "custom" has no catalog entry to derive a proxy target from, so it gets no generated gateway, the same way it gets no generated install command.
The gateway never calls back to Ikhnos, at any point — the same one-way trust model this page describes for telemetry generally: the nginx configuration is the entire enforcement, checked entirely in-cluster, by something the admin applies themselves. Reaching it is a kubectl port-forward to the gateway's own Service, the same shape as reaching the raw tool without it, just pointed at port 8080 instead of the tool's own port. It is deliberately not a substitute for real exposure, either: the proxy is plain HTTP with no TLS of its own, appropriate for a port-forward or for sitting behind something that already terminates TLS, not for facing the open internet by itself.
Cross-distribution deployment
The paths this chart relies on — /var/log/pods, /var/lib/kubelet/pod-resources, each node's own kubelet :10250 stats endpoint — are standardized by the kubelet itself, not by any distribution, so they hold on k3s, kubeadm, RKE2, Talos, EKS, GKE, AKS and OpenShift alike. What genuinely varies by platform is security posture and hard platform limits: Pod Security Admission levels, OpenShift's SecurityContextConstraints, GKE Autopilot's default refusal of privileged/hostPath/DaemonSet workloads, EKS Fargate's lack of DaemonSet support at all, and Kepler's absence of an arm64 image. Deploy → Telemetry on every distribution has the concrete commands for each of these; this page is the philosophy behind why they're needed, not a duplicate of them.
Is data arriving: per-route health
Whether a destination is actually receiving data is not something the chart or the server can know: the collectors know it, because each counts what it sends. Every collector serves its own export counters (otelcol_exporter_sent_* and send_failed_*, per exporter and signal type) on its pod's address (telemetry.health, on by default, port 8888), a headless Service per collector lets the agent find every pod, and the agent reads them every 30 seconds. Counters only: no telemetry content passes through the agent, and what it reads goes nowhere but its own diagnostics.
The agent turns counters into a state per route, because only it sees the readings in order against one clock (a counter says how much went out since a pod started, never when):
- waiting: nothing has been seen to go out yet, or not enough readings to say. A route's counters appear only once something has gone through it, so a signal type with no row at all is waiting too.
- exporting: a counter grew within the last three minutes, so the destination accepted data. This is the destination's acknowledgement, not proof that it shows up in that backend's own UI.
- silent: data went out before but none recently. This is not an error by itself: an idle signal looks like this.
- failing: sends failed recently and none succeeded after the last failure. It clears itself when one gets through.
Growth is measured per pod and a counter that goes down is treated as a restart, so a collector that restarts is not mistaken for silence, and the first reading of a pod is only a baseline (an agent that restarts does not claim "exporting" from a counter that was already high). The state, not the counters, is what makes a diagnostics message new, so a steady route costs nothing between the routine refreshes. The server relays what the agent decided (DiagnosticsDoc.exportHealth), bounded and labelled, and the agent page shows it under Is data arriving? next to the installed signals. When the agent cannot read the counters at all (a NetworkPolicy, collectors that are not running) it says that instead, and says it tells nothing about whether data is flowing.
Because the counters are only reachable by the agent, the chart adds a NetworkPolicy for the host collector (which has no other ingress) allowing the agent alone. It does not add one for the cluster collector, which also takes OTLP from applications: isolating it would cut them off. Where telemetry.receiver.networkPolicy already isolates it, the chart adds the agent's access to that policy, and where networkPolicy.egress limits the agent, it adds the agent's egress to the collectors' port.
Reconfiguration
"Alter it anytime" is a real architectural property, not just a slogan: every telemetry change, at install time or later, is the same kind of helm upgrade --reuse-values command, generated by the UI, run by the cluster owner. withTelemetry() deliberately states every signal and every processor flag explicitly on every call, specifically so --reuse-values can never silently keep a stale value the panel meant to change — which only holds if the form generating that command starts from what's actually installed. The post-install "Change telemetry" panel now seeds its draft from the agent's own self-report (installedTelemetry) rather than a blank form, so a small edit — bump traces sampling from 100% to 20%, say — can no longer silently reset every other currently-enabled signal to off in the same command.
Where this doesn't reach yet
Three things named here on purpose, because a page like this is exactly where they'd otherwise get lost in Helm comments again:
- The agent's self-report today only ever says which signals are on (
CONTINUUM_TELEMETRY_SIGNALS), never how — not the effective export destination, not the effective processor settings, not which accelerators source is in use, not any per-kind application scope override. Extending it to report effective configuration the wayinstalledTieralready reports the effective tier is the structural fix behind a safe "alter anytime" panel, not just the seeding fix above. Still open. - There is no Go-side OTLP emitter behind the
networkLatencysignal yet — the collector-side contract described in Interoperability (the reservedservice.name, the scope exemption) is real and enforced, but the discovery agent doesn't produce that data today. Newly named and scoped here on purpose, now that the collector side is a real, tested contract rather than an implicit assumption: closing it is a Go-agent change, not a chart change. - Fleet-wide telemetry policy is still absent: there is no way to turn a signal on across many clusters in one action. Regional operators close part of the multi-cluster picture — fan-in of what's already being collected — but deliberately not this part; that page's own "Where this doesn't reach yet" section says the same thing from the other direction.
The accelerators namespace-identity gap the previous version of this page named here is closed: namespaceScopable (see Four axes) names the dual classification honestly instead of overloading layer, and the opt-in, off-by-default applyScope flag lets an operator who wants GPU metrics narrowed by the install's namespace scope turn that on explicitly, rather than either silently ignoring scope forever or applying it by surprise.
All three remaining items are open, not urgent: worth deciding on purpose, the same way whether telemetry ever closes the loop back into Ikhnos (and, with it, any future fleet-wide policy) is worth deciding on purpose rather than discovering the answer by accretion.